Feature Request: Sensitivity Spot Diagram

  • 6 March 2024
  • 4 replies
  • 47 views

Userlevel 3
Badge +1

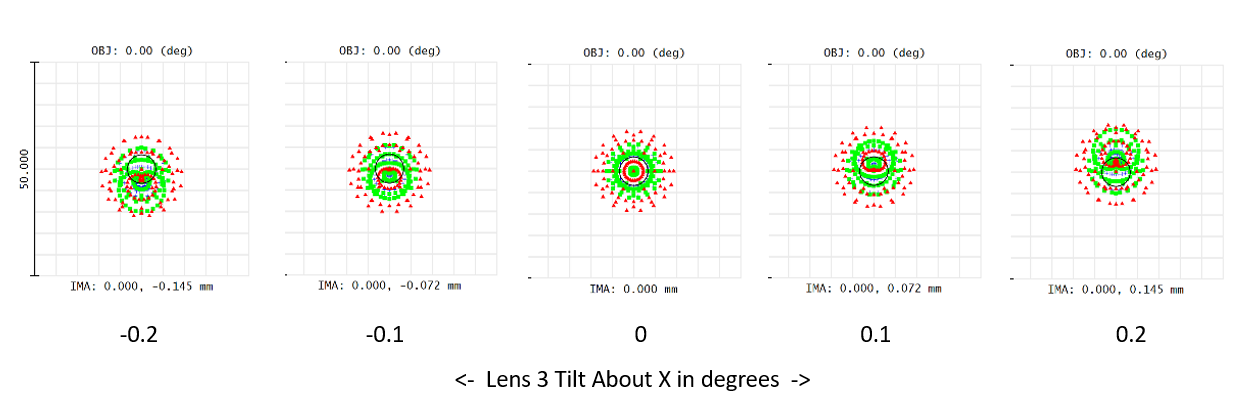
I am thinking of something like a combination of Universal Plot and Through Focus Spot Diagram. The output would be similar to the Through Focus Spot Diagram, but with inputs similar to the independent variable from the Universal Plot.

Example: Pick a surface, vary the thickness, then show how the spot diagram changes. This can help to provide visuals when looking at sensitivities for decenters and tilts at any surface. 


4 replies

Userlevel 7
Badge +2

@Sean Turner 


That’s a great idea. Do you have a specific example in mind, we could have a look at what can be done with the ZOS-API until it gets implemented.

Take care,


David

Userlevel 3
Badge +1

@David.Nguyen thanks for the support!

I think this would require a similar approach to tolerancing, where a pair of coordinate breaks are inserted on either side of a surface, or group of surfaces. 

Here’s an example using the Cooke 40 degree field lens. I added a pair of coordinate breaks around the third element, then tilted it about X.

Spot diagram settings. 


Userlevel 7
Badge +3

@Sean Turner:

You can also consider using the Slider and/or Visual Optimizer tools:


I like the Slider.  You may still need to manually insert coordinate breaks, but this tool allows you to vary system and/or surface parameters and monitor any specific analysis window of interest or all windows at once.

Regards,

Jeff

Userlevel 6
Badge +2

It would be super nice if for a Universal Plot, you could have multiple MFE operands you plot on the same graph (without having to do an Active Overlay).  This wouldn’t provide the exact solution above, but you could plot RSRE for each wavelength and then set the Coordinate Breaks that Jeff was mentioning as the independent variable. 

Reply