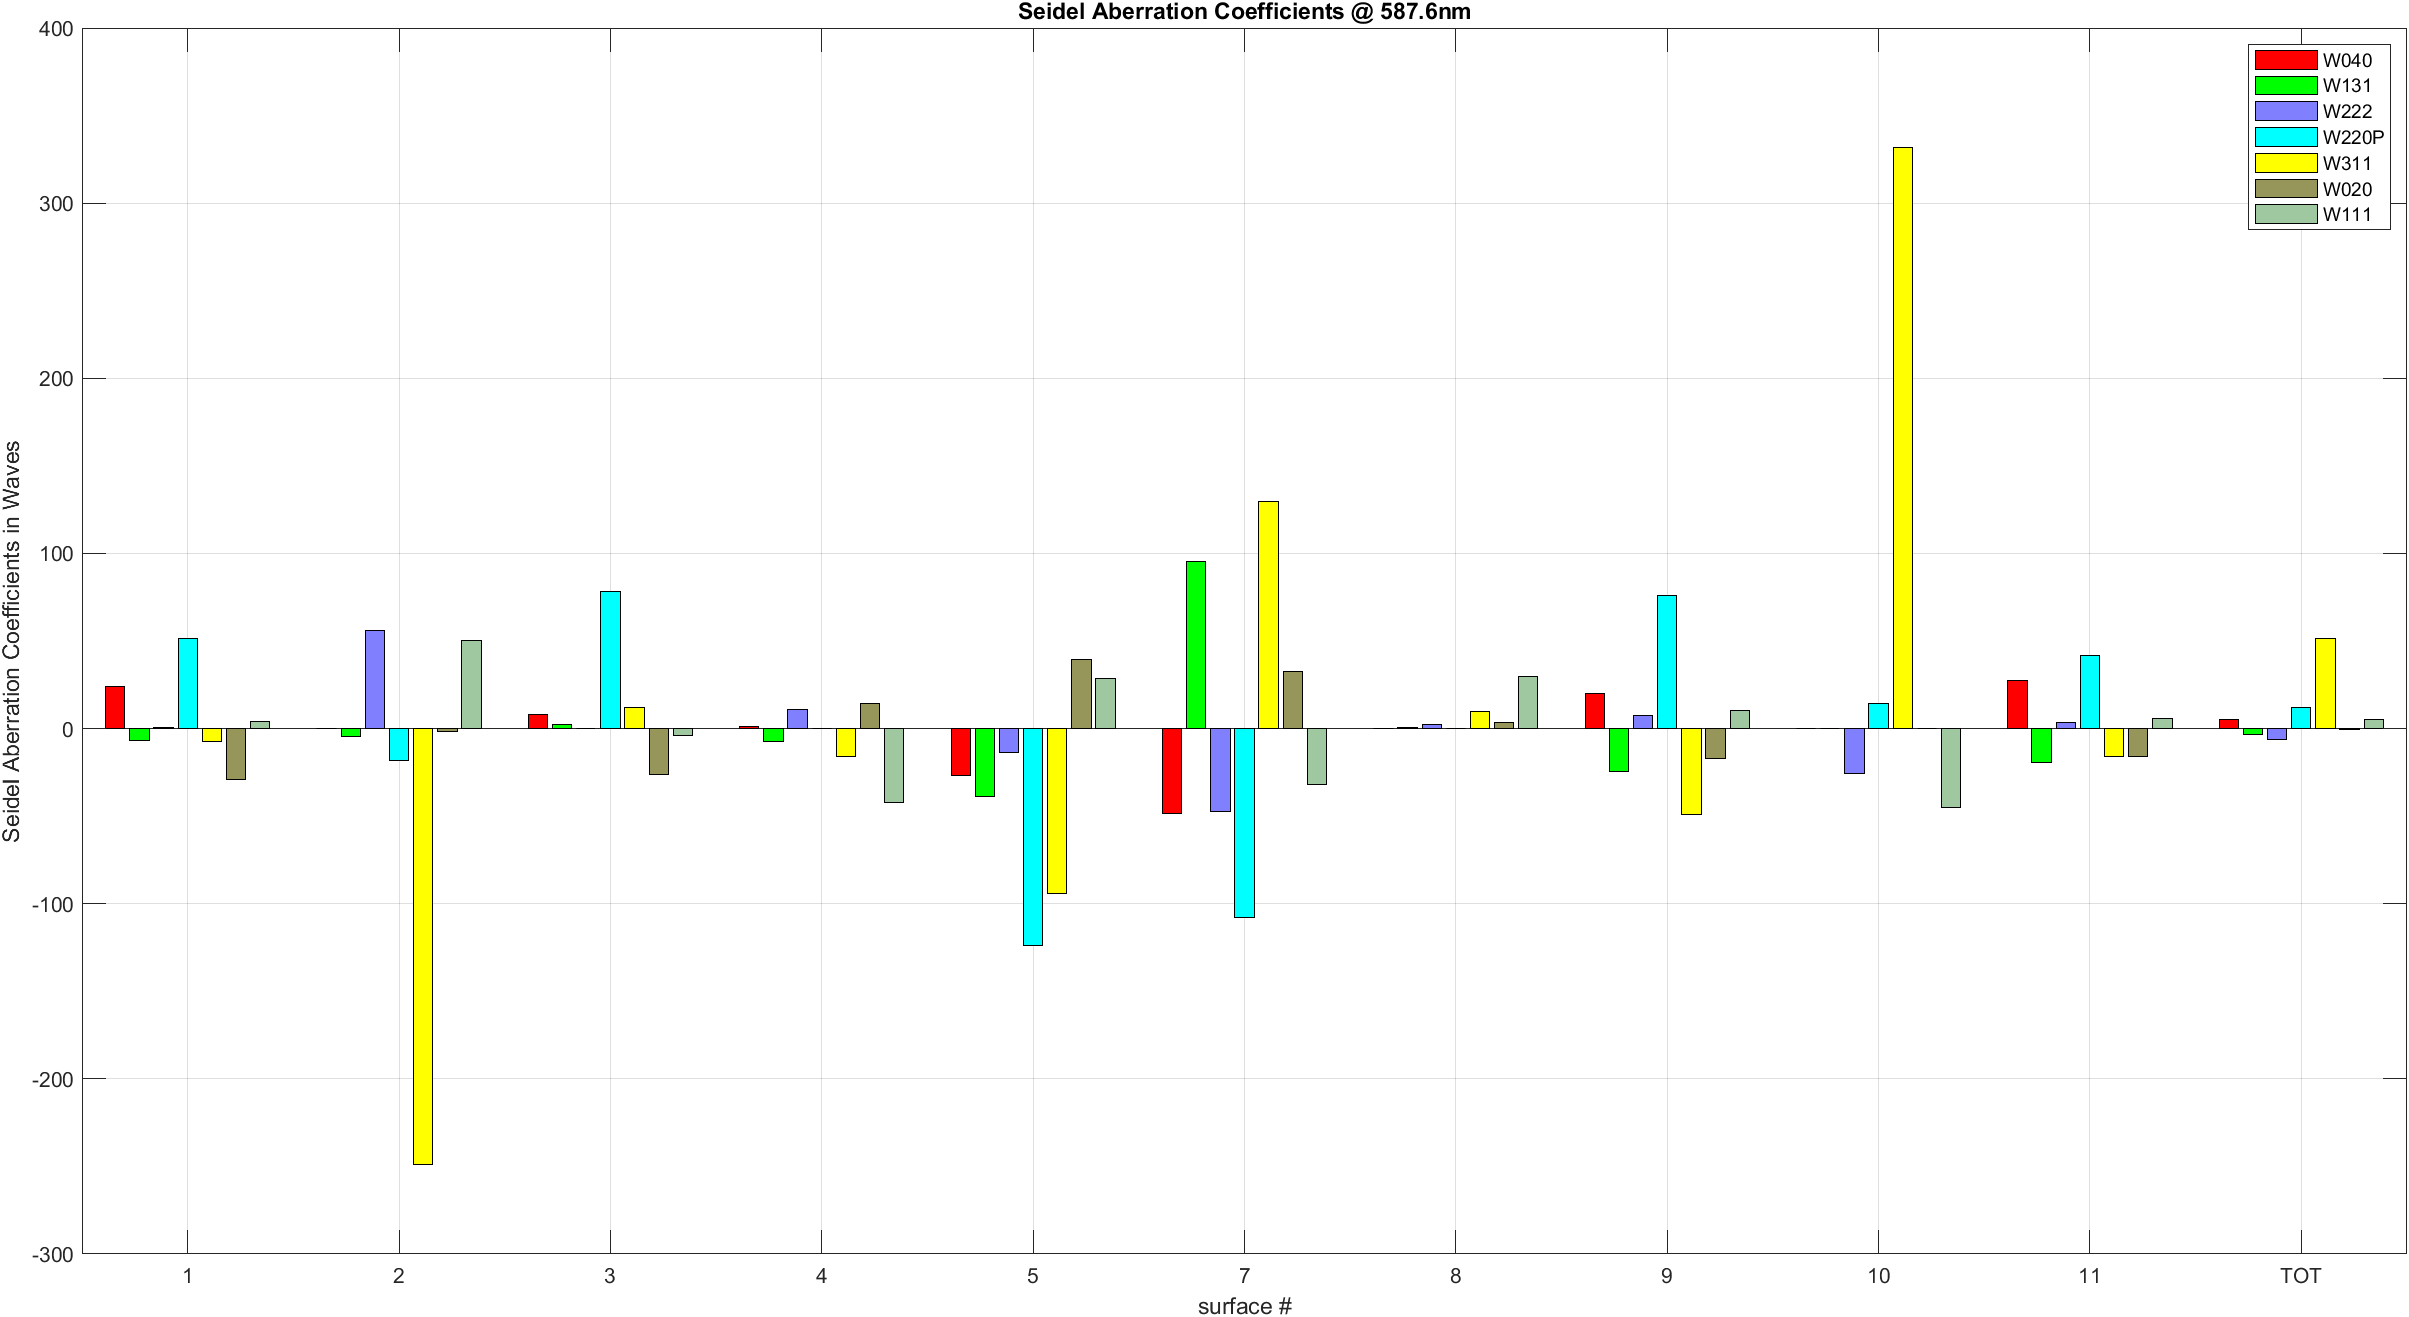
Feature Request: Seidel Diagram option for wavefront aberration units
At least for me, wavefront aberrations in waves are more familiar and appropriate scale for visualizing 3rd order aberrations. Especially when comparing with OPD fans. Obviously the Seidel data in mm can be converted, but it would be a nice box to tick for the bar chart!
Thanks for the consideration,
John
Page 1 / 1
Hi John,
If you don’t want to wait for the feature release, this data is available from the Seidel Coefficients analysis, if I’m not mistaken, which is partially supported by the ZOS-API.
In the Python ZOS-API (and it would be very similar in any other langage) you can create such an analysis:
Finally, you can parse this text file as demonstrated in this Gist (change the path to where you saved your *.txt). The result looks as below for the Double-Gauss example:
You can modify the code to customize the plot to your need, like adding horizontal bars as well, and you may want to verify what I did (cause I coded it quickly), but you get the point.
I hope this can help you.
Take care,
David
Hello David,
Thank your for the excellent assistance! I ran into an issue automating the text file generation(see end of post), but I emulated your parsing python code to archive a similar result in Matlab (file attached). Saving the text file manually isn’t much effort.
I also included removing any surfaces with all zero coefficients. And matched the OS Seidel Diagram colors for fun.
The difference in the two images below (also from 28deg Double Gauss) is helpful in illustrating my motivation for the request.
not a big deal, but this is the interactive extension error I get working from Matlab
Error using matlab.internal.editor.evaluateCode No method 'GetTextFile' with matching signature found for class 'ZemaxUI.ZOSAPI.Analysis.Aberrations.AR_SeidelCoefficients'.
Hi John,
Thanks for the Matlab version. However, for easy interactive use during design I like your idea of simply having a checkbox option for a Seidel bar plot in waves.
The two strings TheApplication.SamplesDir and ‘\test.txt’ don’t get concatenated and instead, MATLAB is looking for a method GetTextFile(string, string), which takes two string as arguments, and this method doesn’t exist. You should always give GetTextFile(string) a single string argument (in the parentheses) and this string should be the result of the concatenation of your two strings. In addition to the solutions proposed by Jeff, from what I remember, you can also concatenate strings in MATLAB by using strcat(), so perhaps some thinglike this works as well (I don’t own a MATLAB licence to test):