Hi Paola,
First, while it would be possible to do using the ZPL macros. I’d recommend using the ZOS-API for this task. It’ll give you more freedom to render your results.
Second, if you simply want to visualize this plot for evaluation. i’d recommend not going through the configurations. Instead if you directly change the tilt values (from coordinate breaks I suppose), you could change the grid and have much finer results to show.
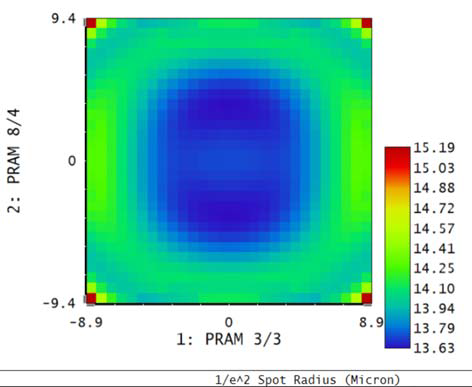
I have made a small example going through the configurations as you asked in Python ZOS-API (Interactive Extension) and I’ve used the RSCE operand to compute the spot radius (you can change to anything you like):
import numpy as np
# Get the Multi-Configuration Editor
TheMCE = TheSystem.MCE
# Get the number of configurations
NConfig = TheMCE.NumberOfConfigurations
# Initialize result vector
BeamSizes = np.zeros((NConfig,))
# Spot size parameters (from RSCE operand)
OpRSCE = ZOSAPI.Editors.MFE.MeritOperandType.RSCE
Rings = 4
# Loop over the configurations
for IndexConfig in range(NConfig):
# Update current configuration
TheMCE.SetCurrentConfiguration(IndexConfig+1)
# Save spot radius
BeamSizes[IndexConfig] = TheSystem.MFE.GetOperandValue(OpRSCE, Rings, 0, 0, 0, 0, 0, 0, 0)
# Reshape the result vector depending on your configurations
Hopefully the code is self-explanatory. The missing step is to plot the results, but that should be relatively simple with the matplotlib module. Some steps are very generic because without seeing your file, I cannot give a more specific answer. Also, keep in mind what I said above: it would give you more freedom to loop over the coordinate break tilt value as opposed to going over the multi-configuration operands. Let me know if you are interested into that and I can also help
Please consider sharing an example file if you require a more specific answer.
Take care,
David


