Solved

Dispersion Diagram

  • 13 May 2020
  • 4 replies
  • 275 views

Hello,


I'm using one of your examples from here:


https://my.zemax.com/en-US/Knowledge-Base/kb-article/?ka=KA-01355


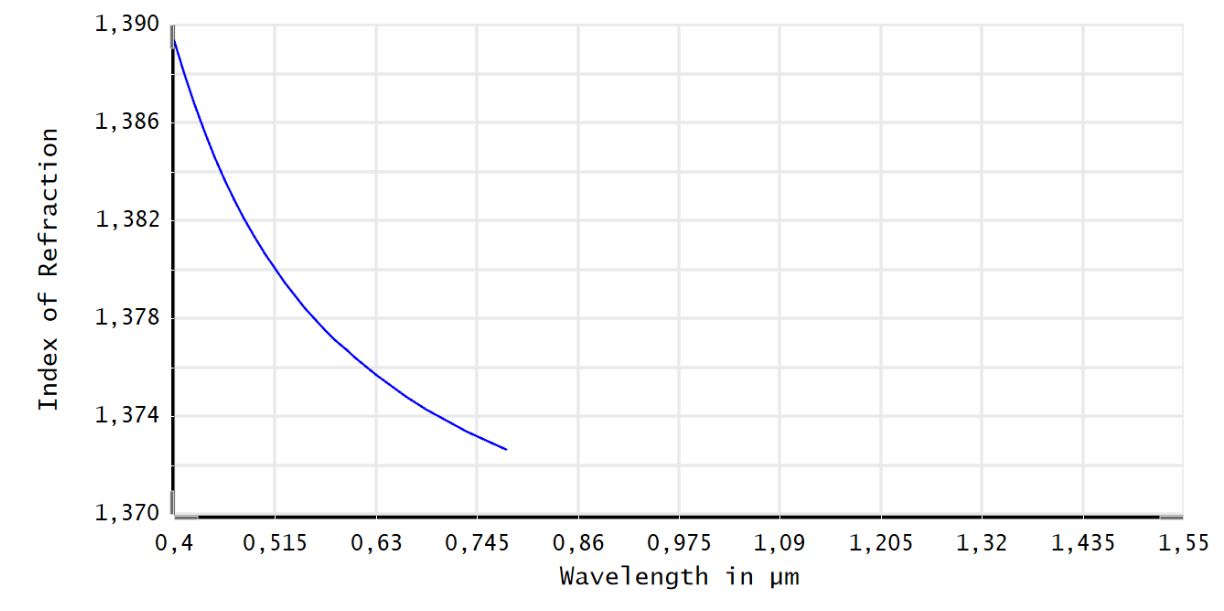
I want to use 1550 nm as a wavelengh however, the dispersion diagram for the materials don't have data for that wavelength - graph below.


Is there anyway to overcome this?


Thank you,


Narciso


icon

Best answer by Narciso.Soares 14 May 2020, 10:06

View original

4 replies

Userlevel 4
Badge +1

Hi Narciso,


You have several options available to you, ranging from easy but risky to longer but more accurate. The curve you are seeing in the Dispersion diagram comes from using the Conrady formula to generate the indices as a function of wavelength. Conrady is one of several commonly used formulas intended to curve-fit the data in a way that is a good fit to measured points. In theory, you can extend it just by going into the Materials Catalog and opening the Eye.AFG that comes with the article as one of the zipped attachments. Then, after selecting CORNEA (which looks like the one you are using) in the box for upper wavelength, you can just type in 1.55 and exit, saving the catalog changes. This will produce a curve that goes out to 1550 and is smooth and appears reasonable. We don't know if it is accurate, however. Going to 1.55 microns is extrapolating to about twice the wavelength given, which is rarely recommended for any extrapolation.


The article mentions using the seawater dispersion as a guide, but it looks like that is for the aqueous and vitrious humors, not for the cornea, which is not a liquid, saline or otherwise. The dispersion curves look different at high wavelengths, and there is no basis for saying either is better.


I think if you want to have accurate results you will have to find published data for corneal tissue into the infrared. It seems likely that the numbers do exist, and you might even get the results in an OpticStudio-compatible format. If you can only find refractive index plots of index vs wavelength, you'll want to go into a user-made catalog (like eye.AFG) and create a new material for your own use. OS can fit the numbers you come up with to any of the curves as long as you have enough data points (three to six, depending on the curve). This will give you maximum control over the accuracy range of your model.

Hello Kevin,


Thank you for your help.

Narciso,


The section on the Navarro Eye Model in the following link should give you the index out to 1014 nm without extrapolation. Which is a little bit closer to your goal.


https://application.wiley-vch.de/books/sample/3527410686_c02.pdf


Hello Andrew,


Thanks for your help.


Regards,


Narciso

Reply