Hi,
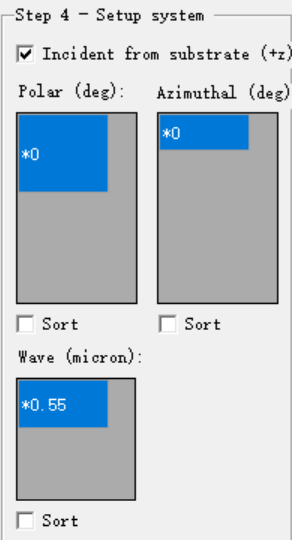
I am confused about Step 4 for the RCWA visualization tool. How can I add wavelengths/angles for plot? It seems I can only change the value instead of adding another slot. Thank you.

Hi,
I am confused about Step 4 for the RCWA visualization tool. How can I add wavelengths/angles for plot? It seems I can only change the value instead of adding another slot. Thank you.
Best answer by lyypaul
Hi,
I am confused about Step 4 for the RCWA visualization tool. How can I add wavelengths/angles for plot? It seems I can only change the value instead of adding another slot. Thank you.
I have the same question on this. Can anyone help?
Latest update.
I have figured out the solution is pressing insert key on the gray area. Hope this can help you.
Enter your E-mail address. We'll send you an e-mail with instructions to reset your password.
Do not provide any information or data that is restricted by applicable law, including by the People’s Republic of China’s Cybersecurity and Data Security Laws ( e.g., Important Data, National Core Data, etc.).
不要提供任何受适用法律,包括中华人民共和国的网络安全和数据安全法限制的信息或数据(如重要数据、国家核心数据等)。