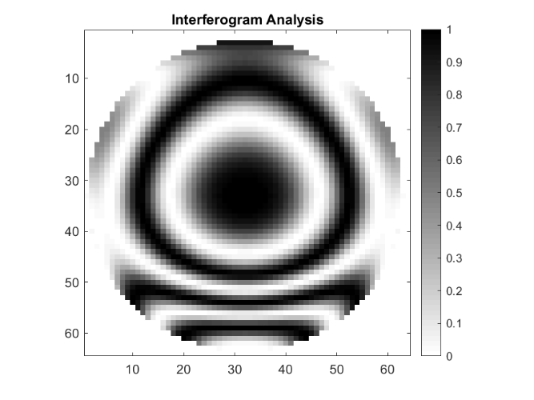
API (Matlab Standalone): Sequential Interferogram analysis plot

  • October 15, 2021
  • 1 reply
  • 293 views

Forum|alt.badge.img+2

This MATLAB standalone code imports data from the Interogram analysis feature, plots the Interferogram data as a MATLAB figure and saves it as a png file. This code was written by Michael Humphreys.

Language: Matlab


Click here to download

Date Version OpticStudio Version Comment
2020/01/14 1.0 19.8 Creation
Did this topic help you find an answer to your question?

1 reply

  • Ultraviolet
  • 36 replies
  • July 11, 2025

Hi ​@Sandrine Auriol : No permission to download the file. Do you have an alternate link?


Reply


Cookie policy

We use cookies to enhance and personalize your experience. If you accept you agree to our full cookie policy. Learn more about our cookies.

 
Cookie settings