Solved

Differential ray tracing using ABCD-transformation for phase space radiance distribution

  • 6 April 2023
  • 4 replies
  • 291 views

Userlevel 1
Badge

Is it possible to calculate space mapping of the light source (LED) radiance distribution onto the target  irradiance distribution in Zemax?

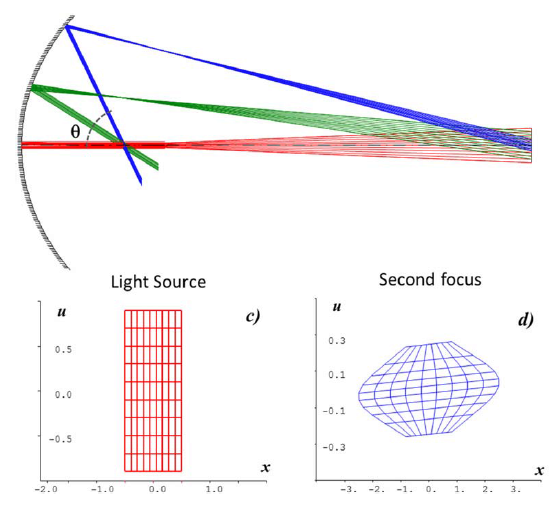
For example, I found the article (link) where authors performed phase space transformation by local ABCD matrixes in CodeV using differential ray tracing function. They traced reference rays and found exact location of the radiance (irradiance) patches, whereas the surrounding local ABCD transformation defines the shape of the radiance patch in phase space and the projection defines the irradiance contribution, respectively.

So basically I want to do the same in Zemax:

  1. Get radiance of the source (light source mapping).
  2. For direction vetor (L,M,N)  calculate ray r which corresponds to a pair of xu-values, where angular variable u is associated with the angle u = n × sin θ of a ray relative to optical axis.
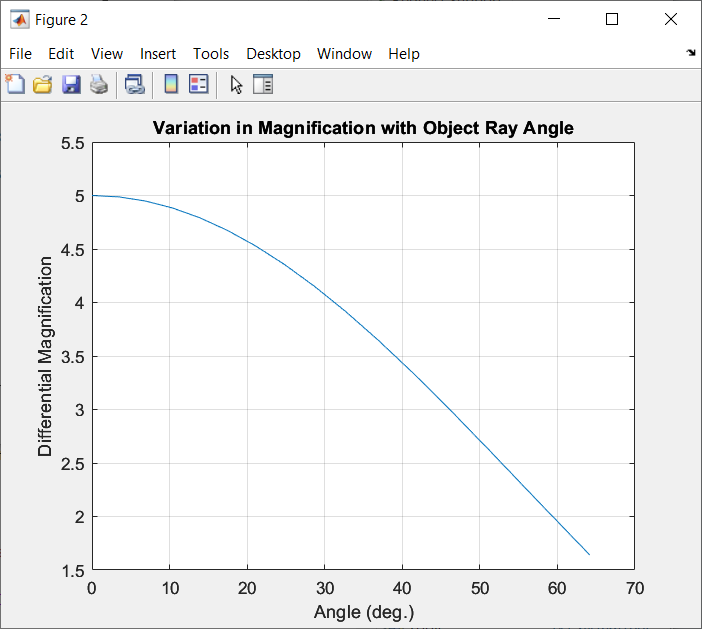
  3. Find ABCD matrix for source→ target mapping.
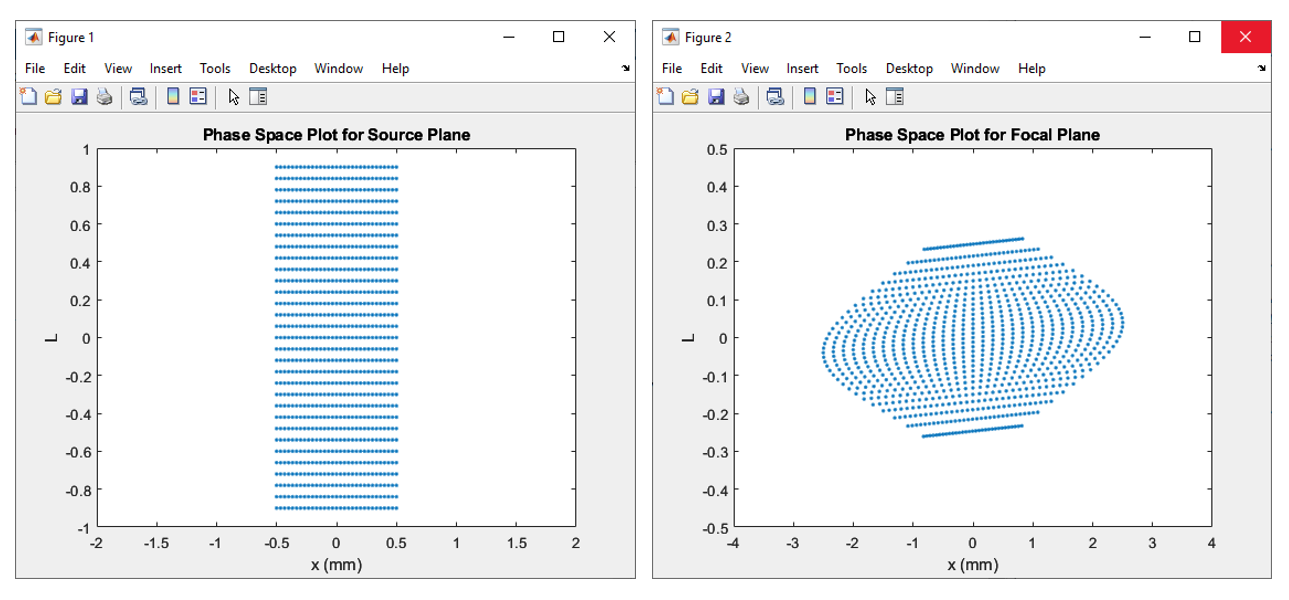
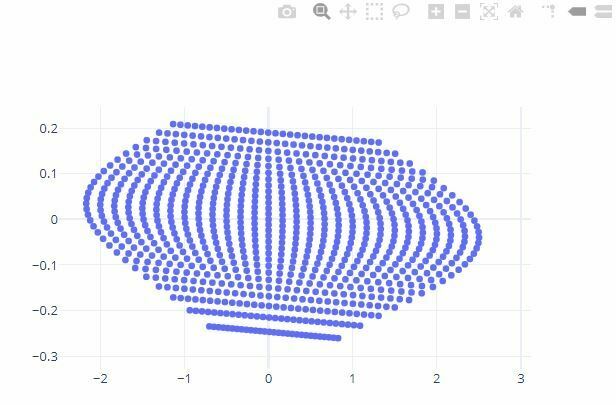
  4. Calculate radiance L(x,u) on the target plane (xu-diagram,  phase space devided into equal areas).
  5. Insert optical element to change irradiation pattern (for example, Lambertian → uniform )
  6.  Optimize the position of the reference rays r and repeat steps 2-4.

I would apreciate for any hints towards implementation of  phase space mapping in Zemax (sequential and non-sequential modes) using ZOS-API or ZPL marcos. 


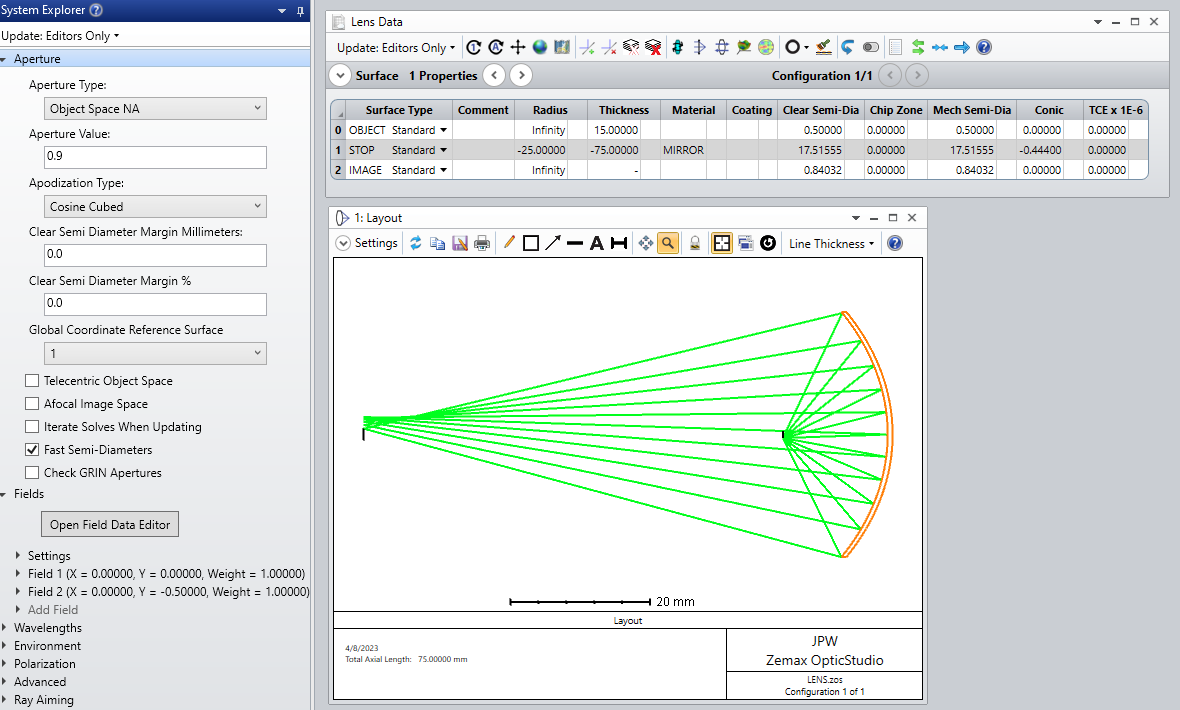
P.S. I’ve already tried  to calculate ABCD matrix  for thick lens as Mr. Sahil described here.

Perhaps, by modifiying this method for calculation of  radiance distribution and E-field for transmitted and reflected rays, we could implement ray tracing function for irradiance
distribution in phase space.

icon

Best answer by Jeff.Wilde 9 April 2023, 05:36

View original

4 replies

Userlevel 7
Badge +3

Thanks for pointing out the article that discusses use of phase space plots to help with the design of an illumination system.  It’s interesting work.

In looking over this paper, it appears that the authors use phase space plots to help better understand the fundamental behavior of the starting optical path (in this case a reflective ellipsoidal collector).  By looking at the initial phase space plot in the illumination plane, they realize what is needed to improve irradiance uniformity is a two-surface freeform corrector optic that helps suppress variation of the magnification over the pupil.  It doesn’t appear that they actually use the entire phase space data directly for optimization purposes (although perhaps a subset may be utilized), but after optimization they show that the new phase space plot is consistent with the improved irradiance uniformity they achieved.

In any event, you asked how one can go about generating phase space plots programmatically.  Since, in general, phase space is 4D, it is not possible to plot the complete version.  However, for axially symmetric systems we can just use a 2D version (like the authors of the paper did).  To get this data, we can use ZOS-API to trace a set of rays emanating from a line in the object (source) plane.  For each starting x location we can define a fan of rays in angle (a sequence of L values, i.e., a set of x-direction cosine values); the complete set of source rays can then be used for batch ray tracing. 

Here is a sequential model that replicates the starting system in the paper:


Next, we need to write a script for batch ray tracing (if needed, I can provide more detail, but see example #22 in the ZOS-API help documentation).  I did this in Matlab, and here is what I find by simply plotting L vs. x for the rays in the object plane and the image plane.


This yields good agreement with the plots shown in the paper:


Hope this helps…

Regards,

Jeff

Userlevel 1
Badge

Hi @Jeff.Wilde ,

Thank you for the answer. It’s very helpful. Could you please share your modified example #22 for L(x) mapping?


I have a couple more questions:

  1. According to the article, after obtaining phase space mapping, authors could get a magnification vs angle from the ABCD matrix. If we do L(x) mapping in Zemax as you suggested, how can we get the values of angular magnification?
  1. About the optimization process, I thought the authors probably did the optimization by using phase space mapping as the merit function. How can we do similar optimization in Zemax for a uniform light distribution? 
Userlevel 7
Badge +3

@nikitasatcik:  I’ve attached the Matlab script.

  1. It’s relatively easy to extract the differential magnification from the ray tracing data, just compute (dx_image)/(dx_object), centered about some particular x value (say x = 0), as a function of object ray angle.  I’ve added this to the script.  Here is the result:


  1. In sequential mode, it should be fairly simple to evaluate the magnification for a few object-space ray angle values spanning the pupil.  Then you can optimize the shape of the freeform corrector to minimize the variation in magnification.  In addition, there are multiple ways to optimize irradiance uniformity in non-sequential mode.  Here are a couple of links to good webinars:

There are probably other good webinars and articles that you can find by searching.

Regards,

Jeff


Userlevel 1
Badge

@Jeff.Wilde , thank you very much!

I could reproduce phase space mapping:

Next, I will proceed with the optimization. Thanks for the references about irradiance optimization. They look suitable for my case.


For now, this completely solved my question.

Again, thank you very much for your time and effort.

Reply