Question

Put tolerance editor line numbers on all tolerance outputs

  • 26 January 2024
  • 6 replies
  • 111 views

Userlevel 5
Badge +3

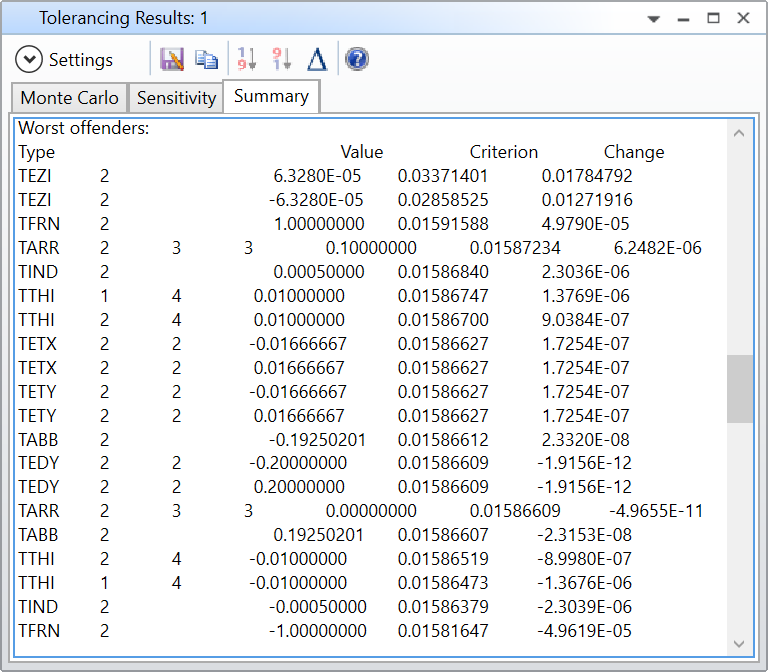
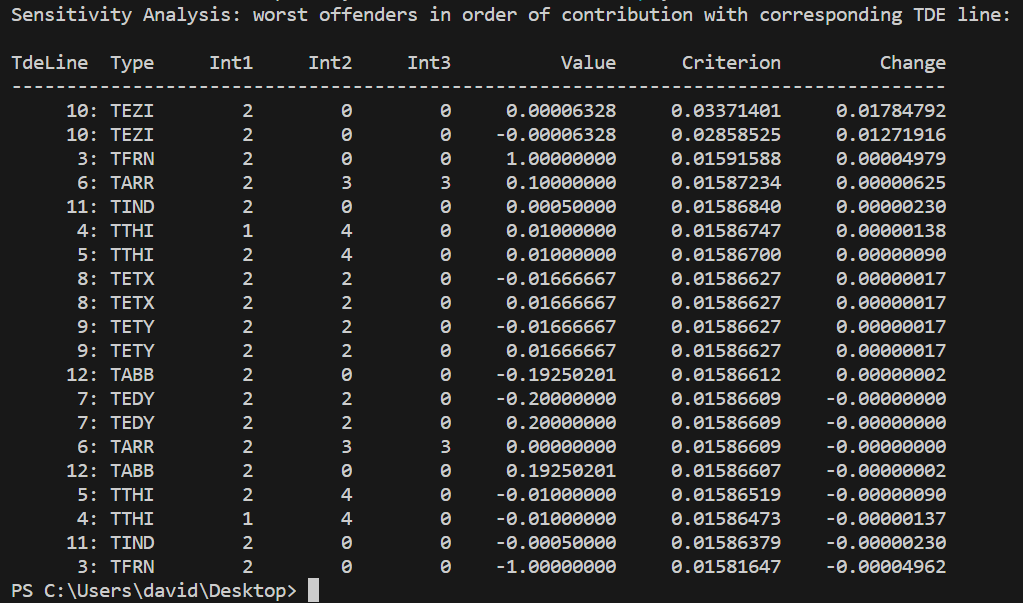
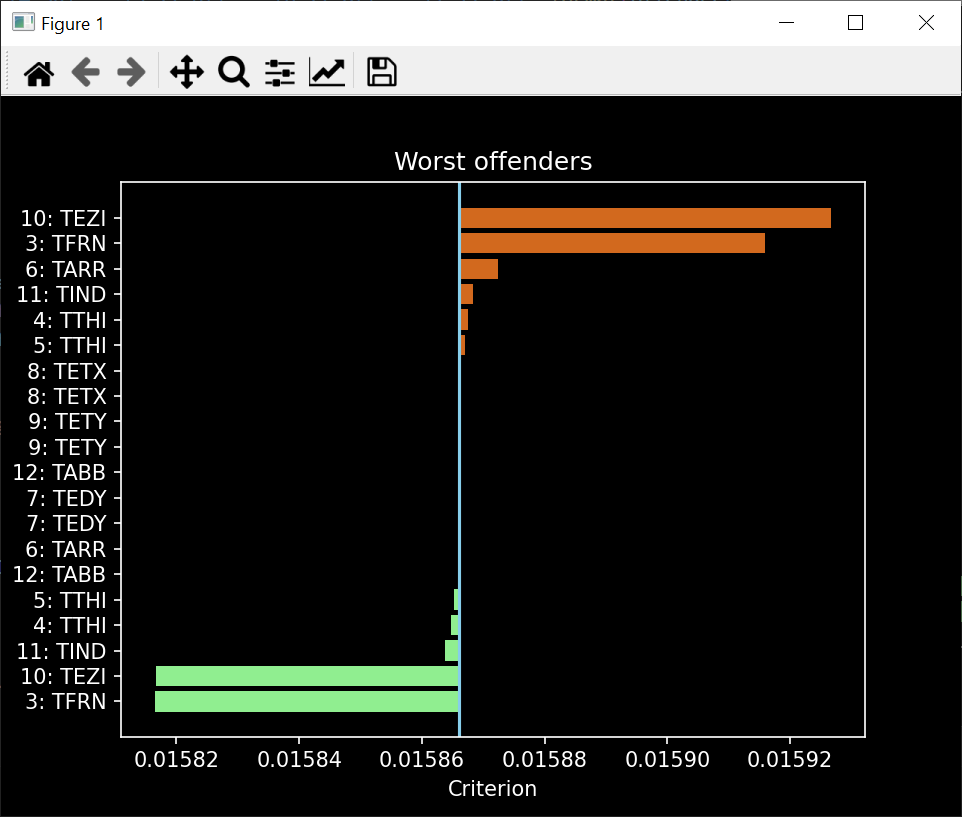
When reviewing the results of tolerancing, it would be SO much more convenient if the tolerance editor line numbers were part of the listings.  I have 200+ tolerance operands and I’m wasting a lot of time scrolling down the Worst Offenders and trying to find them in the editor so I can modify them. Please add?


6 replies

Hi Mike,

Thank you for reaching out to us! And for your suggestion! May I ask you to give me more information on your request so my team and I can evaluate whether we can make it as a feature request? It would be helpful for me to have a description at which report specifically you want the numbers as part of listings. Also a screenshot would be nice!

Kind Regards,

Niki 

Userlevel 7
Badge +2

 @Mike.Jones 


I’m assuming you are talking about the Worst Offenders of the Sensitivity Analysis.

It is possible to get what you want through the ZOS-API, although not as straightforward as I initialy thought. This is what the code linked below outputs from that same Tolerancing Results shown above:

The code assumes you’ve ran a Tolerancing into your file before connecting the ZOS-API. Obviously you can edit this to behave differently, e.g. you want to run the tolerancing from the ZOS-API as well.

You can find the code on my GitHub at this address:

https://github.com/Omnistic/worst_offenders_with_TDE_line

It requires the brilliant ZOSpy module that is developped independently from ANSYS (please read their Referencing section if you decide to use it).

I might do some more work on this in the future, any other question let me know.

Take care,


David

Userlevel 5
Badge +3

Thanks David!  He is showing exactly what I was asking for.  However, instead of having to load up modules, get up to speed on yet more software and run separate routines, it would be SO MUCH better for we users to simply add TDE line numbers along with all tolerancing outputs.  You already have everything you need to do this; just bring it up to the surface.  Tolerance listings can be enormous, and being able to go directly to operand line numbers to modify their tolerance limits would be so much better.

Mike

Userlevel 7
Badge +2

@Mike.Jones,


In a perfect world, I would agree with you. However, allow me to play the devil’s advocate for a brief moment. Assuming resources are limited, I’m not sure it is the best use of the development team to focus on data visualization. First, data visualization hasn’t really been the trademark of OpticStudio, and the world of data science has come a long way in the last decade, with many brilliant tools readily available through Python. Second, as you said, there is already everything to do it, whereas there are many more issues for which we don’t have a workaround at all. And what’s more, thanks to the ZOS-API, you can display your data however you like, which might be different to another user might like, and therefore there is no need for ANSYS to try and please everybody.

My goal was not to dismiss your point, which is still completely valid and I understand your frustration. Instead, consider this an invitation to look at the opportunities that the ZOS-API bring through its direct connection with Python.

I added a draft to create a bar plot of the worst offenders, its already on my repo:

Take care,


David

Userlevel 3

I agree.  I had the same problem recently.  This is one of those things that should be easy to add, and saves the user a lot of time/hassle. 

Userlevel 5
Badge +3

David,

Simple additions to Zemax like this are part of what we pay so much a year of support for.  I don’t think this as excessive to ask of Zemax coders for this simple modification.  It’s just changing a print statement a tiny bit!

I do like your worst offenders bar chart a lot, but that’s certainly not a simple addition to the native code.  If that were needed I would look deeper into the work you’ve done.

Mike


Reply