Hi Michael:
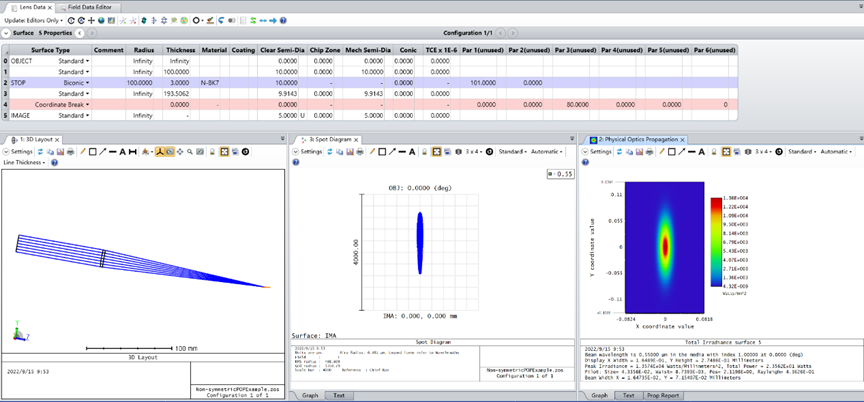
I am trying to simulate the illumination pattern when a bundle of focusing beam obliquely incident on the (image) plane. A system diagram is shown in the figure below. I use the same ZMX file as an example which was discussed in The reason POP and geometrical methods give different results. My question is that the POP result is always the result with normal incidence even I followed your method described in “Why is the spot orientation different between POP and Spot Diagram”.
Figure 1. System diagram.
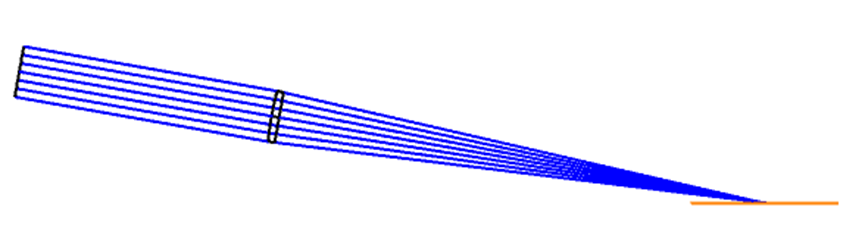
I use the coordinate break to tilt the image plane so that the focusing beam obliquely incident on the image plane with an angle of 80°. Due to the image plane is at a defocus position, the bottom side of the image plane is closer to the focal point, while the top side of the image plane is father away from the focal point. In this case, the spot diagram is more like a droplet, rather than an ellipse which is the case with 0 tilt. However, the POP result is always the result with normal incidence.
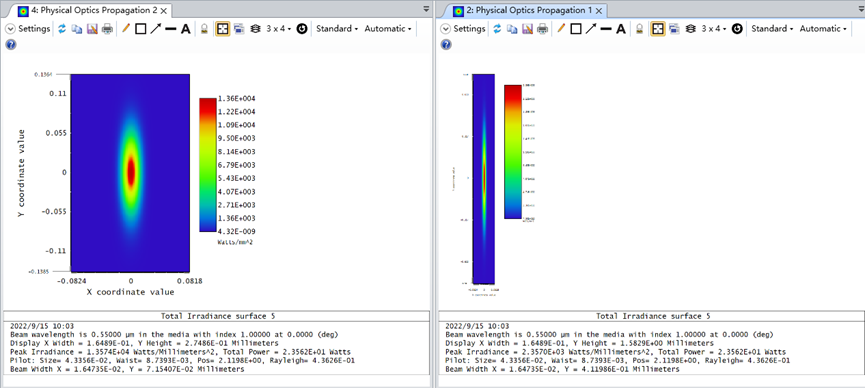
Figure 2. Normal incidence case.
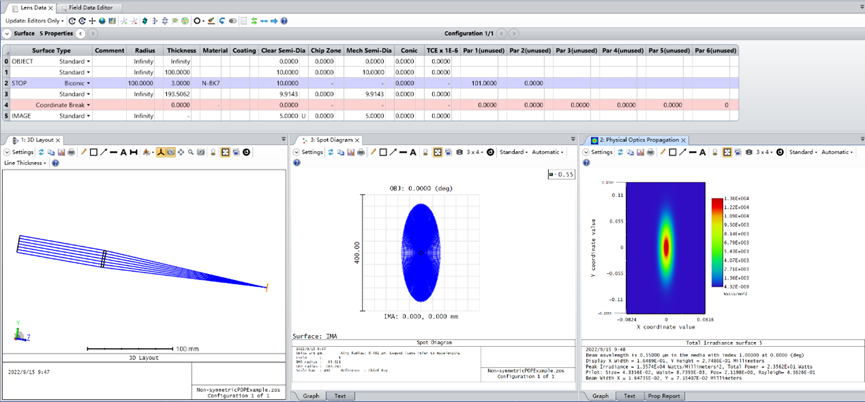
Figure 3. Oblique incidence case.
In the POP settings, to change the project direction, I can obtain the projection pattern with “Along Normal”. However, the projection pattern seems very ideal. Is it true? As just described, when the image plane is tilted, the defocus is different for different positions. Thus, the spot diagram indicates a droplet like spot. But the POP projection result is still a perfect extended ellipse.
Figure 4. Along Beam Projection vs Along Normal Projection
I hope that the orientation of the POP window is same with the spot diagram. As discussed in “POPD ignoring coordinate breaks”, the POP beam is always centered and perpendicular to the chief ray at a given field / wavelength. So, I followed your method, that is,
1. Add a dummy surface right after the surface you want to compare POP and Spot Diagram.
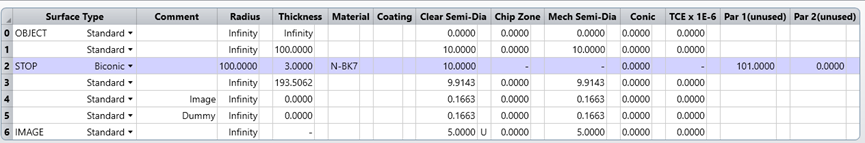
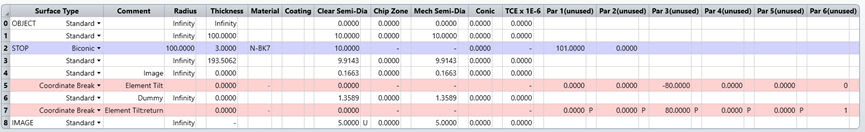
Here, I add two surfaces before the image plane. One is named as Image, the other is named as Dummy.
Figure 5. Add dummy surface.
2. If there is a thickness between the dummy surface at its previous one, cut ant paste that value from previous surface to the dummy surface.
Here, no change to the LDE since the thickness between the dummy surface and its previous one is zero.
3. Use Tilt/Decenter Tool to automatically add a pair of CBs around the dummy surface.
Here, a pair of CBs around the dummy surface.
Figure 6. Add a pair of CBs.
4. Convert the “Orientation matrix after:” in Prop report on that surface to TiltX/Y/Z and type them in the CB.
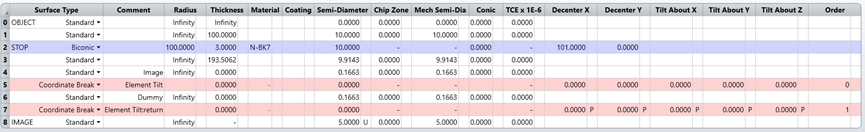
Here, I am not sure which orientation matrix should I convert. The orientation matrix I used is the data where I add a coordinate break to tilt the image plane by 80°. See Figure 7.
Figure 7. Orientation matrix.
Orientation matrix after:
1.000000000 0.000000000 0.000000000
-0.000000000 0.173648178 0.984807753
0.000000000 -0.984807753 0.173648178
Based on the method discussed in “The reason POP and geometrical methods give different results”, Tilt about X/Y/Z are,
Tilt about X: ATAN2(R33, -R23) = ATAN2(0.173648178, -0.984807753) = -80
Tilt about Y: ASIN(R13) = ASIN(0) = 0
Tilt about Z: ATAN2(R11, -R12) = ATAN2(1, 0) = 0
Then, I type the calculated data in the CB.
Figure 8. Type the converted data in the CB.
5. On this dummy surface, now the beam axes is same as the local surface axes. You can compare Spot Diagram and POP result.
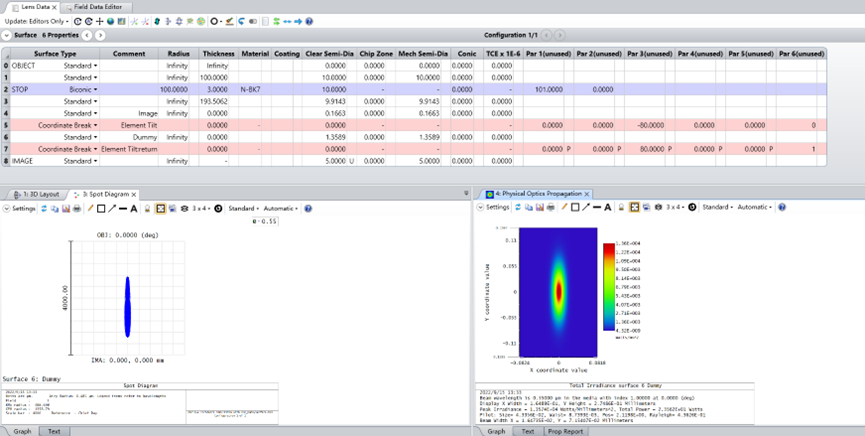
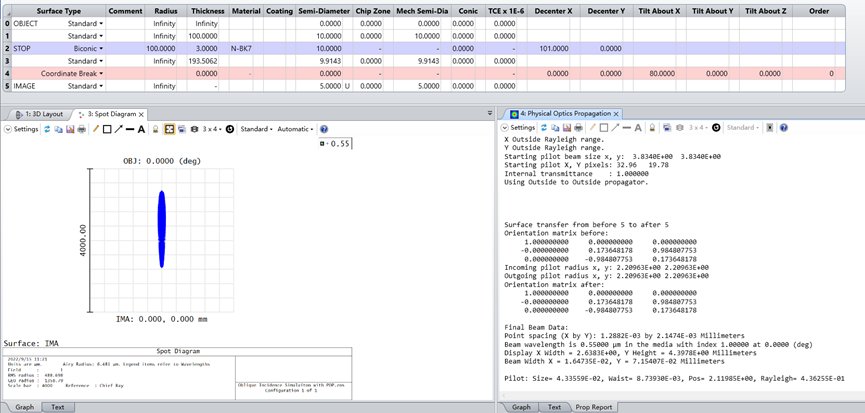
Here, I check the spot diagram and the POP result of the dummy surface. The spot diagram shows a droplet like spot, while the POP result is still a symmetric ellipse. Did I do something wrong? The ZAR files are attached. Could you please give me a hand?
Figure 9. Spot diagram and POP result at the dummy surface.