Hi 恒介 木村,
I'm sorry I didn't know how to spell your name.
I might be able to help.
The way you describe this problem makes me think it might be a more suitable, and scalable approach to use the ZOS-API as opposed to the ZPL Macro. Are you familiar with any of the following programming langages: Python/MATLAB/C++/C#?
Would you be able to share a simple example of DAT files in their folder, an archive of your optical system, and what kind of results you'd expect?
Based on whether you prefer to go for a macro, or the ZOS-API, I can offer further guidance.
Cheers,
David
Hi All,
Thanks for your posts here!
恒介 木村, as David mentioned it is possible to automate this process either via a ZPL macro or using the ZOS-API. Depending on your preferences, we have learning paths for both options, please find the links below:
Getting Started with ZOS-API · MyZemax
ZPL Programming · MyZemax
If you choose to go with the API as David suggested, then you may find more information in these knowledgebase articles and forum threads about how to import grid data to a surface, as well as how to pull and then plot the results of an alaysis from the API:
How to convert any sequential surface to a Grid Sag Surface using the ZOS-API · MyZemax
How do I output the image of an analysis in ZOS-API? · MyZemax
How can I pull Peak Irradiance or Total Hits from the Detector Viewer analysis in the API? · MyZemax
Best,
Csilla
Hi Mr. David and Ms. Csilla, thanks for your kindness help.
Thanks again to Ms. Csilla for your suggestion and the reference links. I will look forward on it after this. This might be very useful to me.
To Mr. David, thanks again because you want to guide me on this problem.
At first, I am familiar in Matlab and Scilab. And I think I might go with the ZOS-API as it seems to have a lot of references.
I attached a folder of DAT files and my optical system in folder below.
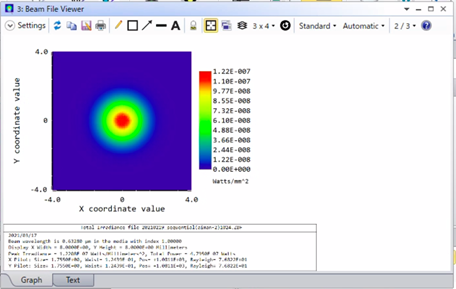
The kind of result I expected is the beam profile in txt file of the image of the system.
For example, after I imported the DAT file in Grid Phase (configuration 2, surface 26 in my system), the beam profile will be deformed at image surface. Then, I would like to save the beam profile (Text) in the image surface from the Beam Viewer feature as shown in image below.

Thank you
Hi 恒介 木村,
You may import grid data from a file to the Grid Phase surface using the following lines in MATLAB:
gridSurf = TheLDE.GetSurfaceAt(26);


gridSurf.ImportData.ImportDataFile(filename);
Then you can run a POP analysis and pull the Text results directly from there. In the following forum thread you may read more about how to change the POP settings directly from the API (if needed), and then how to run the analysis and retreive the numerical results:
Physical Optics Propagation (POP) - API settings · MyZemax
For further references about the MATLAB API, please check out these knowledgebase articles:
MATLAB & ZOS-API - webinar · MyZemax
ZOS-API using MATLAB · MyZemax
Understanding the main Interfaces of ZOS-API using MATLAB · MyZemax
Tips and tricks when using the ZOS-API with MATLAB · MyZemax
Best,
Csilla


