It’s mentioned in the help that the field curvature plot shows the distance from the image surface to the paraxial image surface as a function of field coordinate. Is this a result of paraxial ray tracing?
Best answer by yuan.chen
View original

 +3
+3
It’s mentioned in the help that the field curvature plot shows the distance from the image surface to the paraxial image surface as a function of field coordinate. Is this a result of paraxial ray tracing?
Best answer by yuan.chen
View original
+3
This is translated from Yihua’s post in Japanese.
像面湾曲の値はどのように計算しているのでしょうか。 | Zemax Community
For each sample point in the field, OpticStudio determines the Z coordinate of the paraxial focal plane based on a parabasal ray trace in the X and Y directions (for sagittal and tangential), and then compares this to the Z coordinate of the system image surface. The tangential data are the distances measured along the Z-axis from the image surface to the paraxial image surface measured in the tangential (YZ) plane. The sagittal data are the distances measured in the plane orthogonal to the tangential plane. The base of the plot is on axis, and the top of the plot represents the maximum field (angle or height).
Below is an article about the paraxial ray tracing.
Understanding paraxial ray tracing – Knowledgebase (zemax.com)
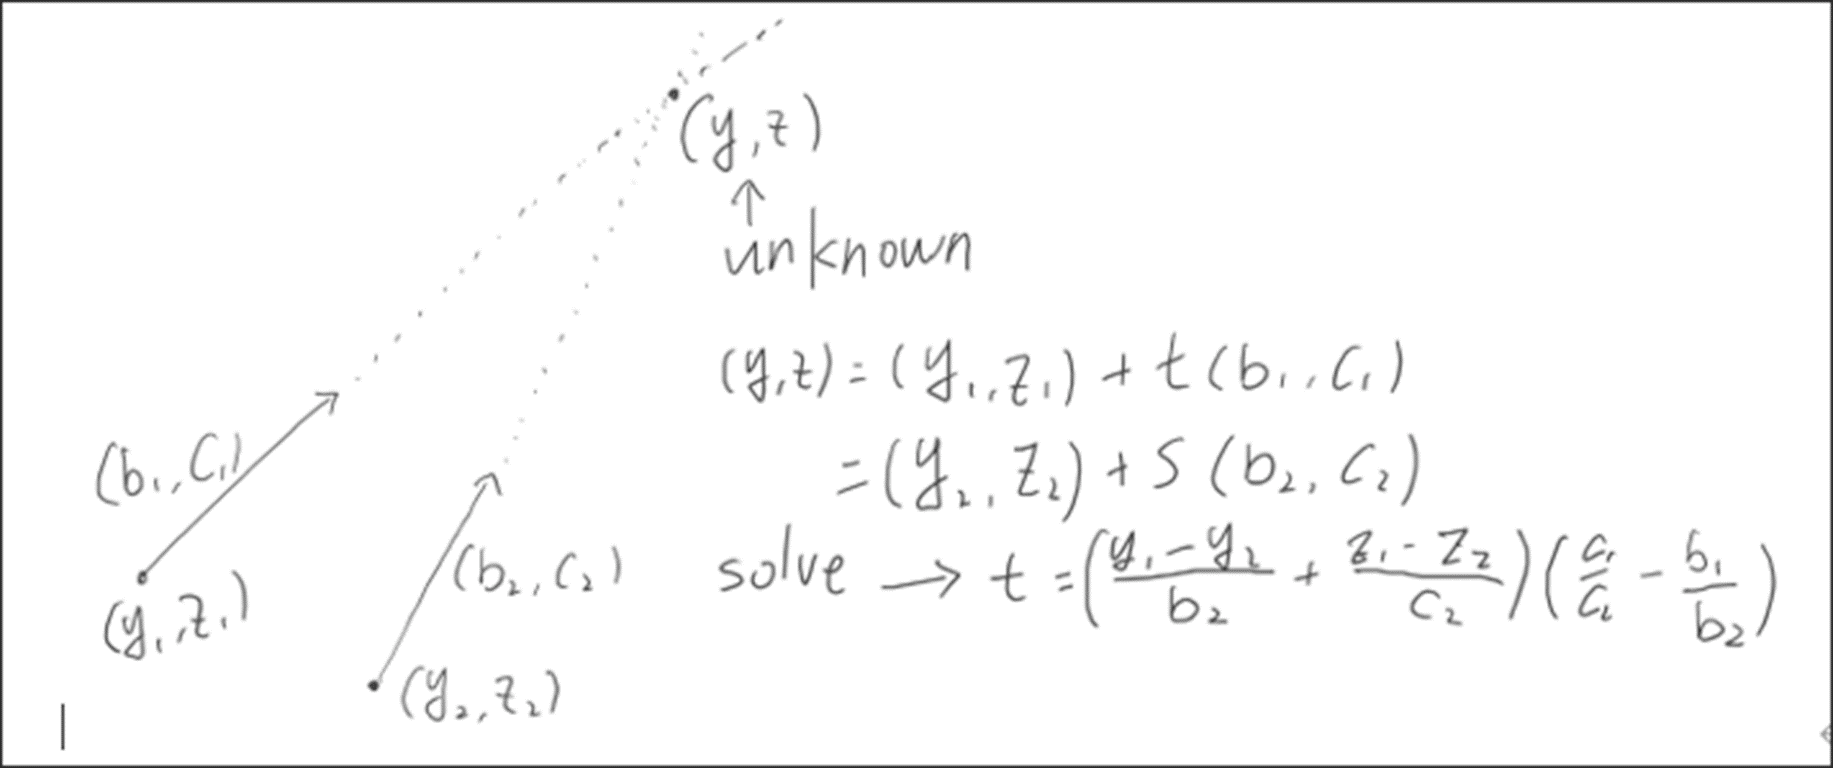
The paraxial image position is the global coordinate of the intersection of these two rays.
Ray 1:(Hx, Hy, Px, Py) = ( □, □, 0 ,0)
Ray 2:(Hx, Hy, Px, Py) = ( □, □, 0 ,0.001)
(□:ray from arbitrary field)
To verify this, Yihua made a macro:
The Y, Z coordinates can be obtained by the coordinate from the surface which is before the image surface.
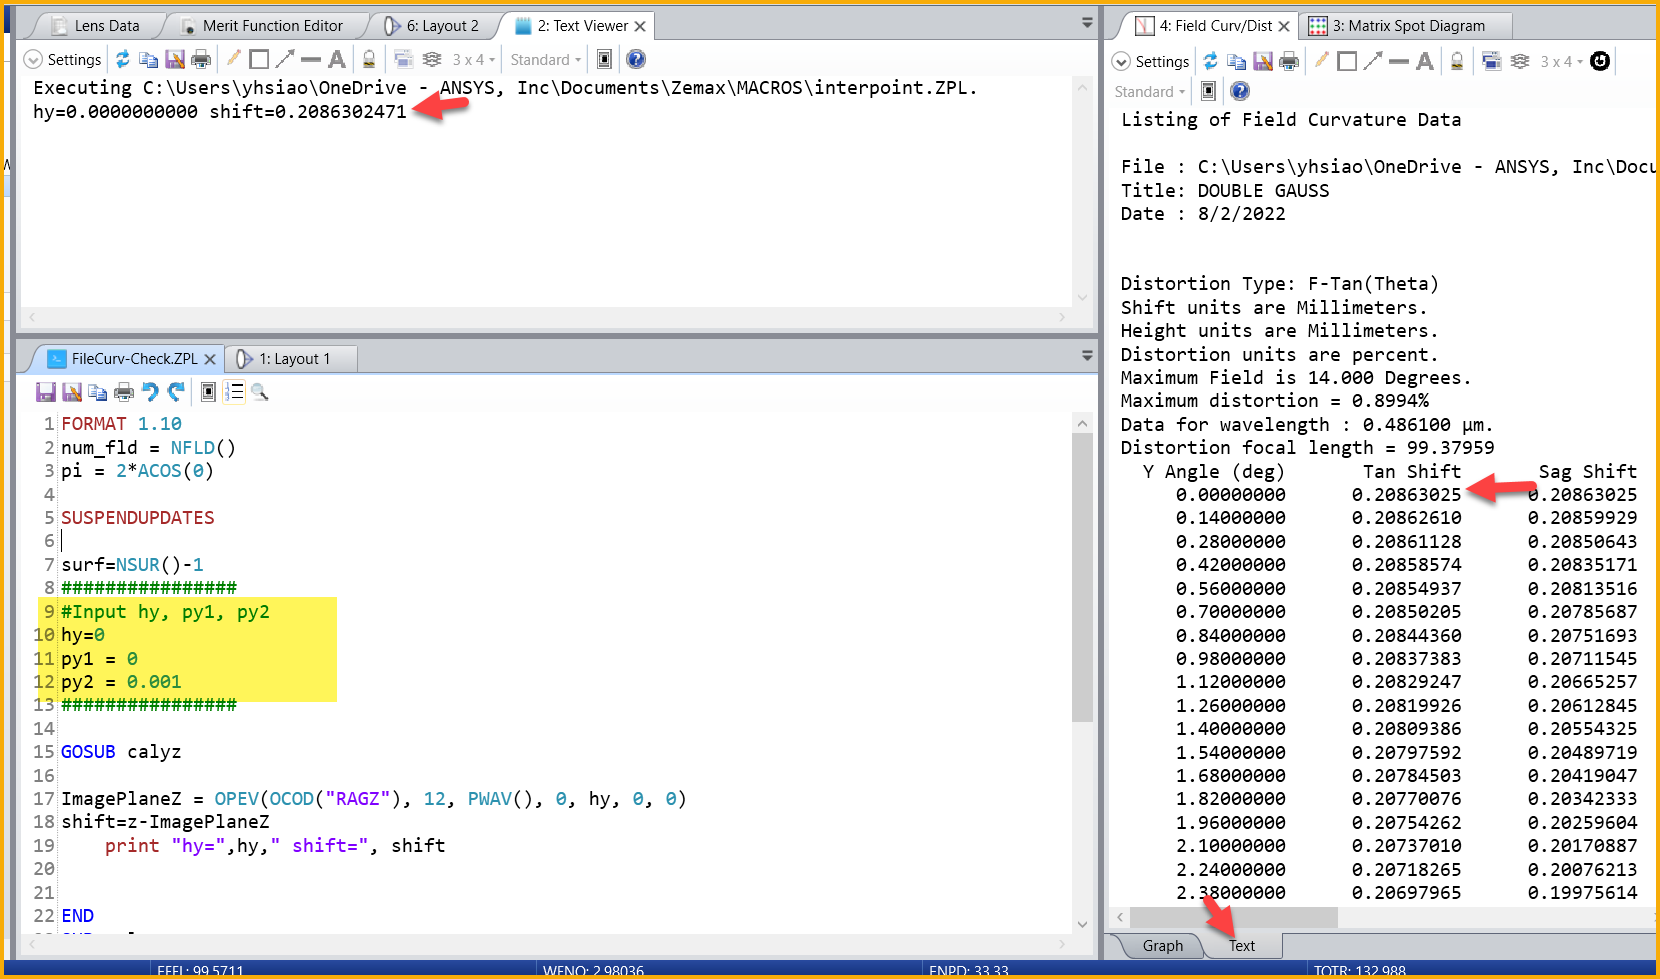
The FCGS and FCGT follow the same principle.
+3
About the calculation of distortion focal length
+3
Add macro
+3
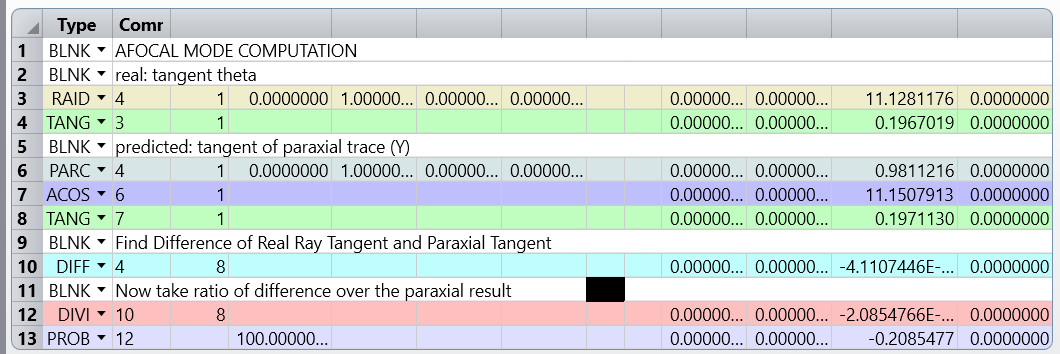
In afocal mode, the direction cosine is calculated instead of ray height. Here is how this value is calculated.
Enter your username or e-mail address. We'll send you an e-mail with instructions to reset your password.
Do not provide any information or data that is restricted by applicable law, including by the People’s Republic of China’s Cybersecurity and Data Security Laws ( e.g., Important Data, National Core Data, etc.).
不要提供任何受适用法律,包括中华人民共和国的网络安全和数据安全法限制的信息或数据(如重要数据、国家核心数据等)。