
Introduction and methods
We are designing the optical system for Chromatic Confocal Sensor (CCS) in which spectral response from the detector corresponds to axial position of the measured sample. We decided to apply raytracing-based approach since it is suitable for finite-sized pinholes [1,2] and we assumed minor diffraction impact since our system is characterized by high Fresnel number (>400) and spot sizes are expected to be greater than diffraction limit due to the utilization of broadband source.
Double-pass analysis was implemented into SC-mode (Figure 1).
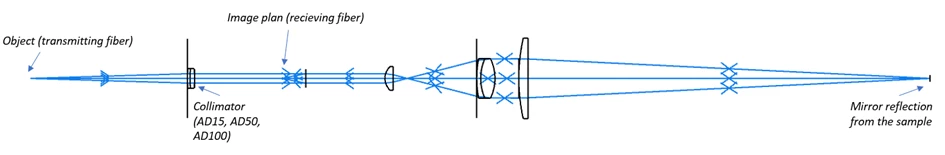
Figure 1. Layout of the system
We used Encircled Energy analysis (similarly like [1] and [2]) to find a fraction of energy that is reaching the detector for multiple wavelengths. As a result, energy, limited by pinhole size (50 µm), was read for every individual wavelength and spectral peak was plotted and fitted with Gauss (Figure 2). In this approach, the illumination pinhole (transmitting MMF core) is represented as homogeneously emitting circular object (Field size of 0.1 mm).
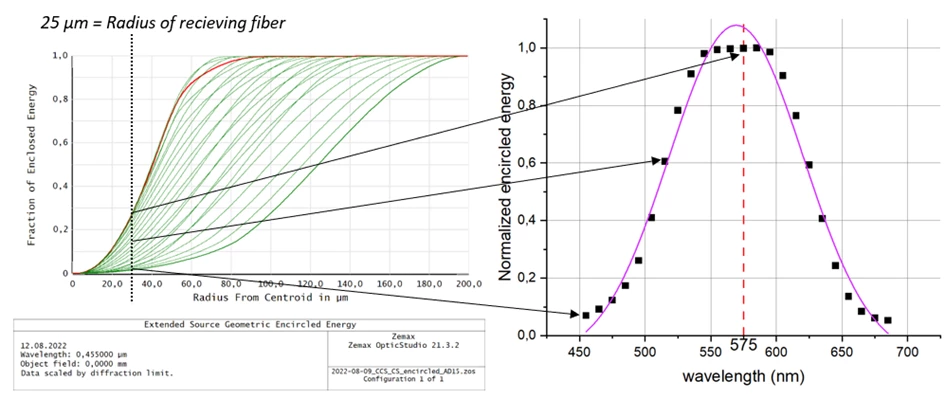
Figure 2. A method for determining the spectral response of the system.
Results
Within the simulation, we tested three different collimators (achromats) characterized by different focal lengths: 15, 50 and 100 mm (further named AD15, AD50 and AD100 respectively). For every setup spectral response was plotted for two position of the sample, set 1 mm apart: named as z0 and z1 (Figure 3).
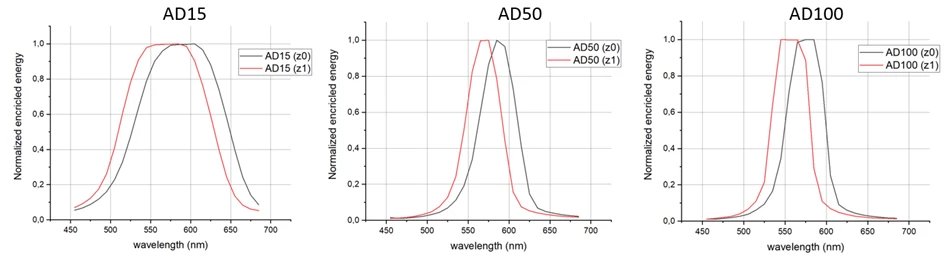
Figure 3. Spectral responses (peaks) for different collimators (AD15, AD50 and AD100)
To validate the results, we built identical physical setup on the optical table and determined two main values that characterize CCS optical system, namely: Longitudinal Chromatic Aberration on 1 mm shift (distance between spectral peaks) and FWHM of the spectral peaks. Data from both simulation and experiment were fitted by Gaussian function.
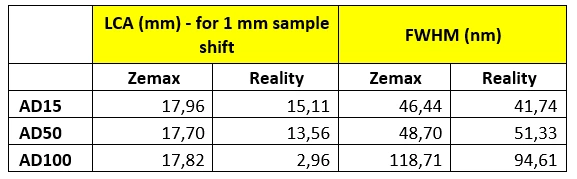
Table 1. Simulation and experimental results of LCA and FWHM.
The problem
As can be seen in Table 1, Zemax gives almost identical LCA, independently from utilized collimator, however in reality we are observing strong influence of this factor and we cannot name the reason for that. We tried conducting similar simulations in ray-based NSC and trend is like SC. We also tried to change the transmitting fiber to different core size and it didn’t change LCA in the simulation, whereas it significantly affected LCA measured in real optical system. I would like to ask community if you see any reasons why changing collimator or fiber size would influence chromatic aberration in this case and why we are unable to see it conducting geometrical simulation.
Appendix
Additionally, I am attaching a few details about setup and simplifications made that could turn out to be important in solving this:
- Simulation assumes uniform distribution (circle emitting rays), which in reality is probably more Gaussian shaped since the fiber core is no angled in relation to axis of the optical system
- In the simulation, off-axis parabolic collimator was swapped with paraxial lens with corresponding focal length
- Object position is placed in BFL of each collimator.
- In real setup spectrometer was used to record spectral peaks (two different ones were tested and gave similar results)
- In all Encircled Energy analysis “Multiplied by diffraction” were ticked
- Diffraction encircled energy plots for central wavelength (best focused) were shown in Figure 4
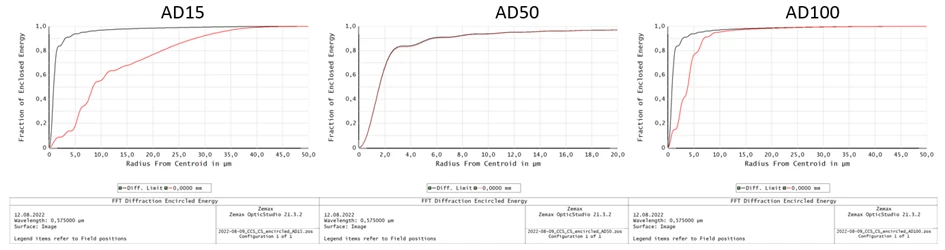
Figure 4. Diffraction encircled energy for different collimators (AD15, AD50 and AD100)