I trying to create a plot of an element tilt vs beam center location.
What would be the simplest way to create such a plot?
I trying to create a plot of an element tilt vs beam center location.
What would be the simplest way to create such a plot?
Depends how you tilt your element and whether you are talking about sequential or non-sequential mode.
Let’s assume you mean sequential mode.
We can have a tilt mirror like so:
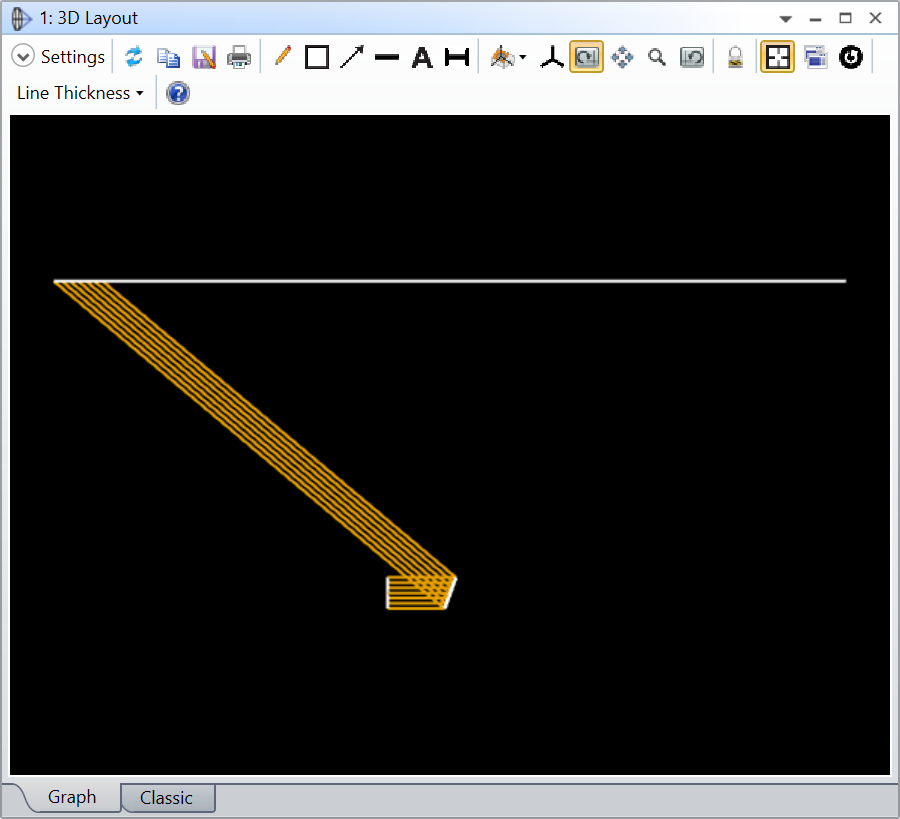

Then, you can use the Analyze..Universal Plot..1-D..New…
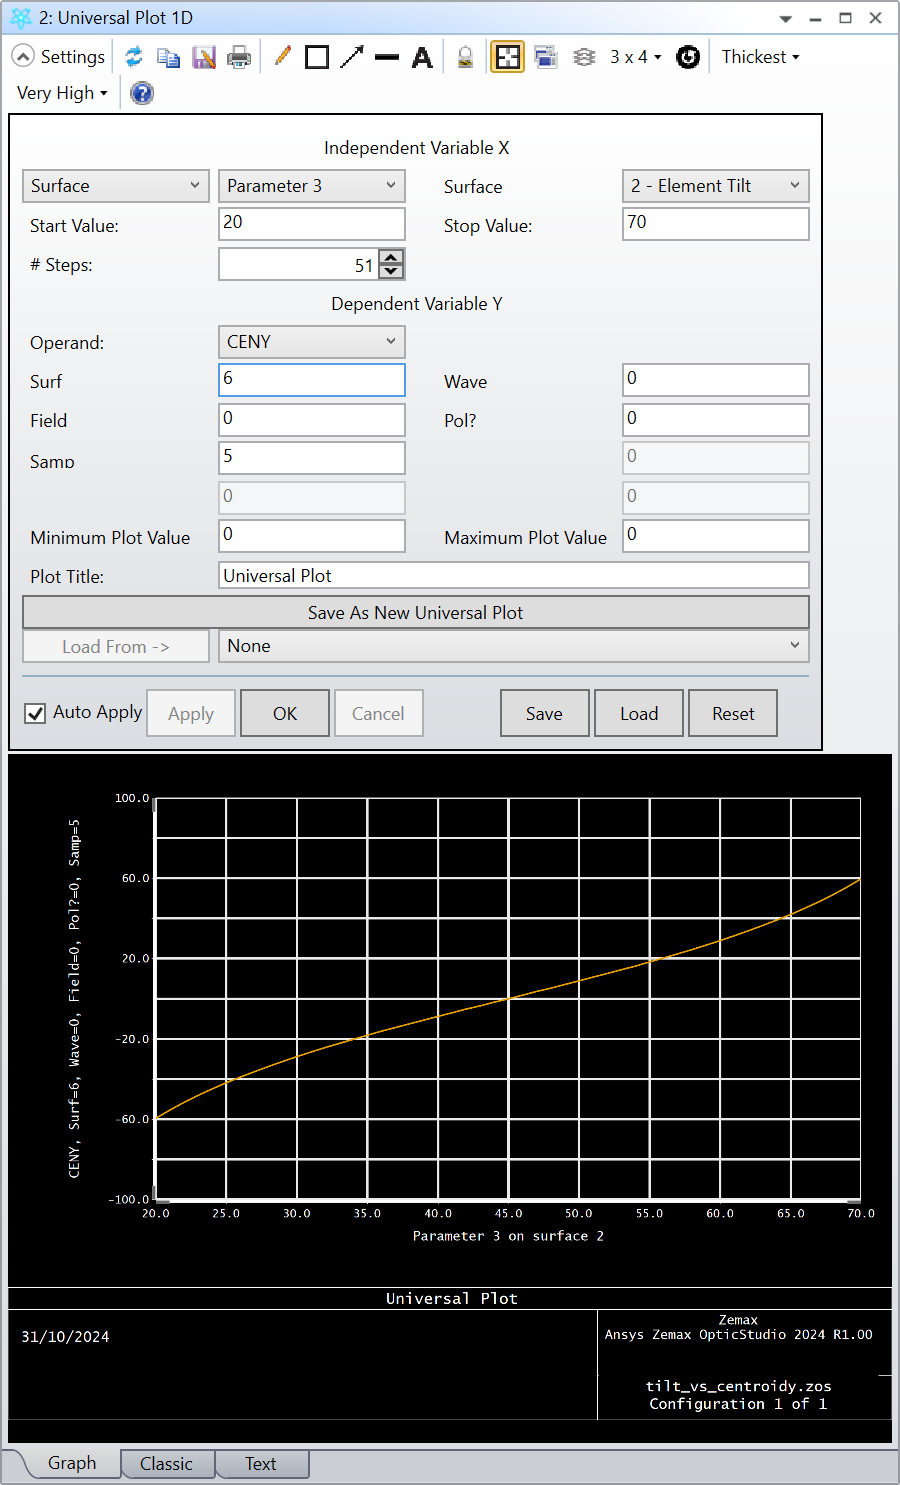
In this plot, I vary the element tilt from 20 deg to 70 deg. I used the operand CENY to report the Y centroid location at the last surface.
I will also attach my file to this reply.
I hope this helps.
Take care,
David
Hi David,
Thank you very much for your help. This is exactly what I needed.
One more question if you may…
Is it possible to plot the centroid location vs. element tilt plot with the consideration of all fields and just a specific one and all wavelengths (if I have more than one)?
Many thanks for your help,
Itay
I’ll start by saying that OpticStudio (OS) isn’t the greatest tool for data visualization. The 1-D plots are convenient, but as you’ll see, limited. If you want to have greater freedom for your plots, I highly suggest looking into the ZOSAPI, which you can use to plot the data in MATLAB/Python.
That being said, there’s still a way to achieve what you want in OS. In the menu bar of the plot, you’ll find a button to clone the analysis.
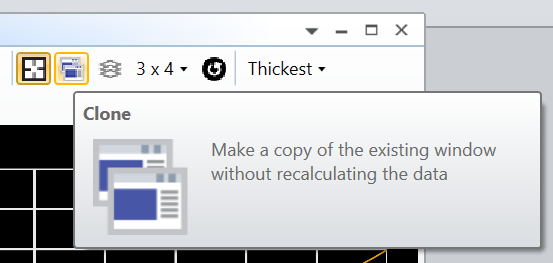
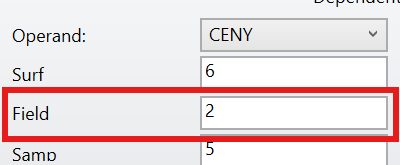
This create an exact copy of the 1-D plot that you had. In each plot, you can adjust the settings to have only one unique field. In my dummy example, I added another field at 2deg, and my two analyses are setup with a unique field number for the CENY operand.
Finally, there’s another button in the menu bar of the plot called Active Overlay.
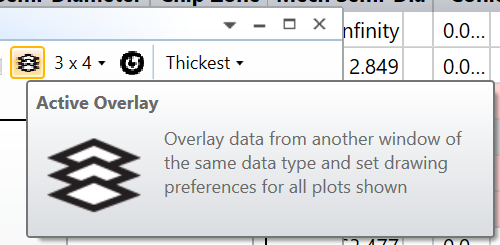
This enables you to add data from another plot to the actual plot.

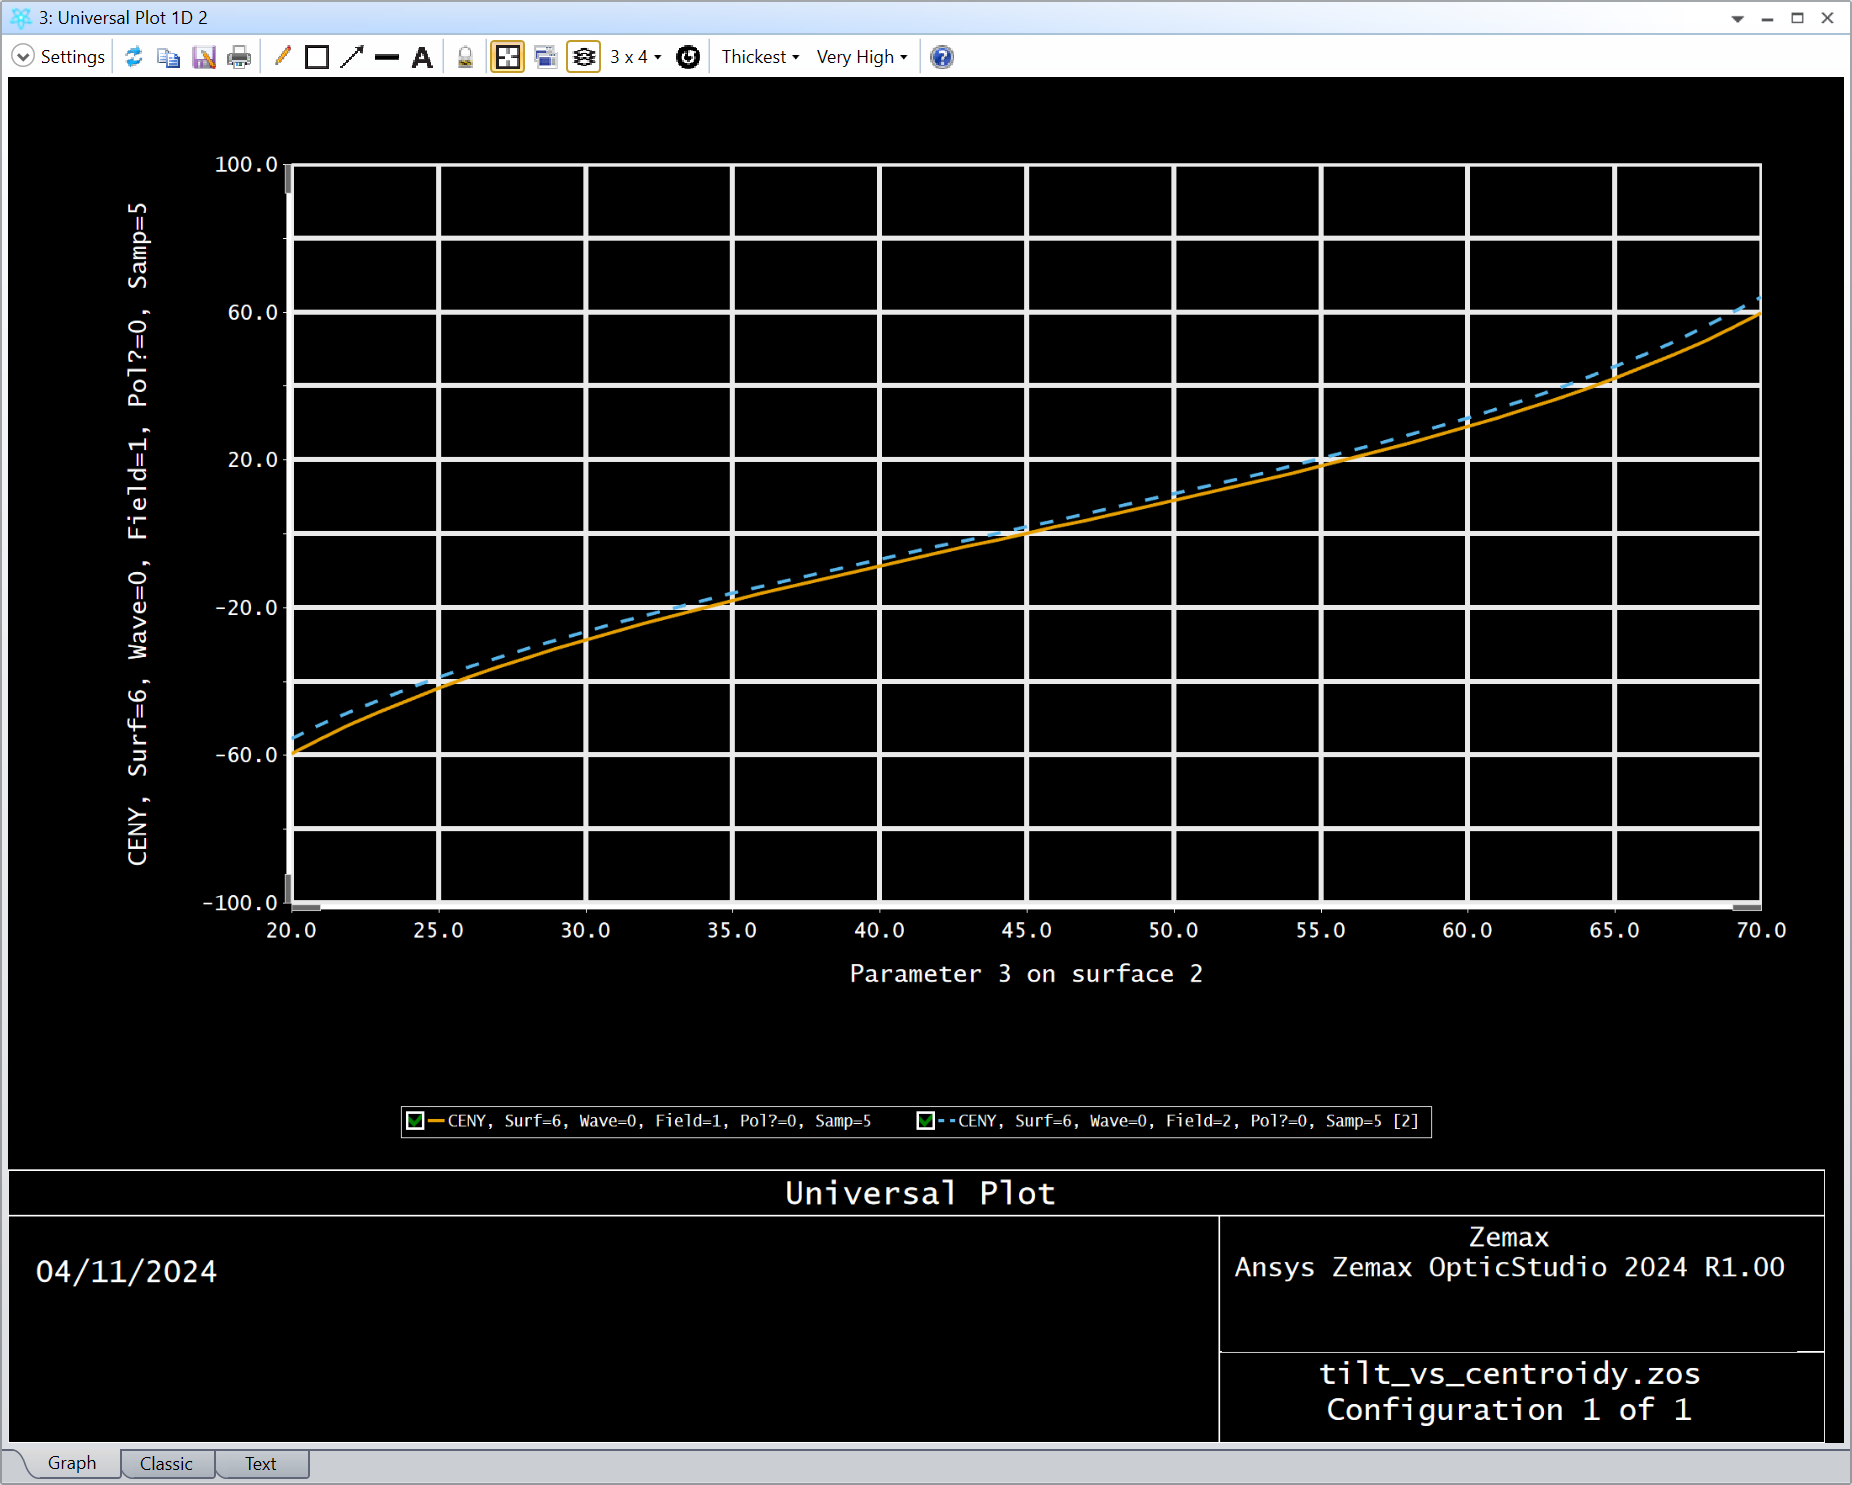
I hope this helps.
Take care,
David
Hi David,
Thank you very much for your help!
Best Regards,
Itay
Enter your E-mail address. We'll send you an e-mail with instructions to reset your password.