
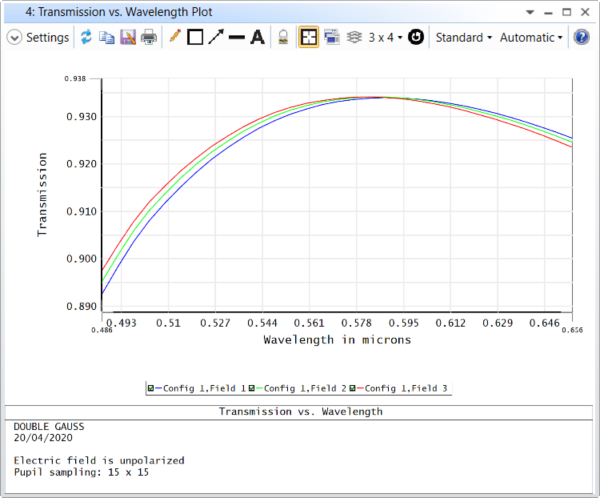
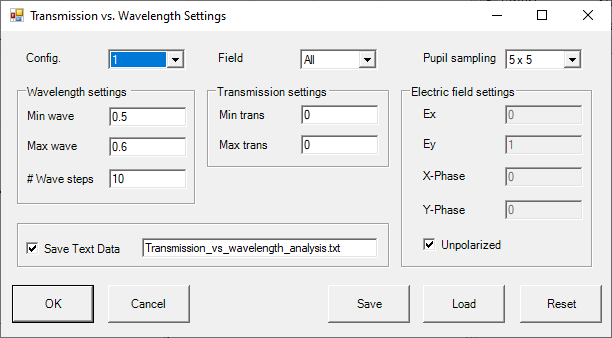
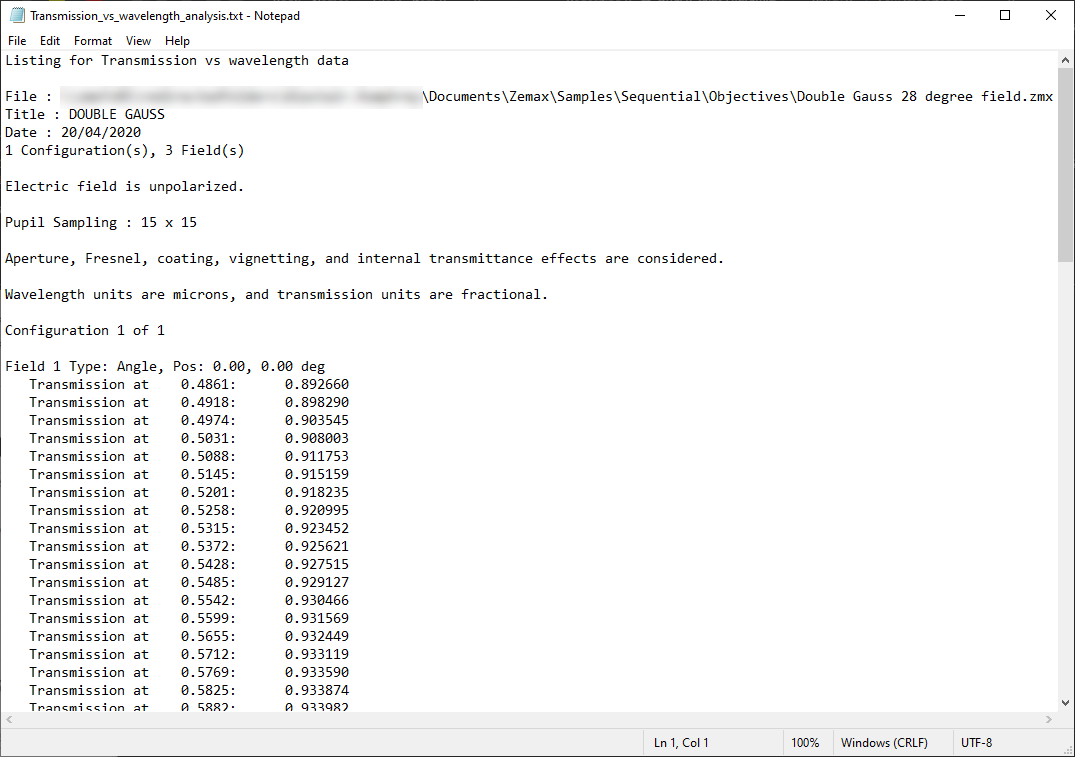
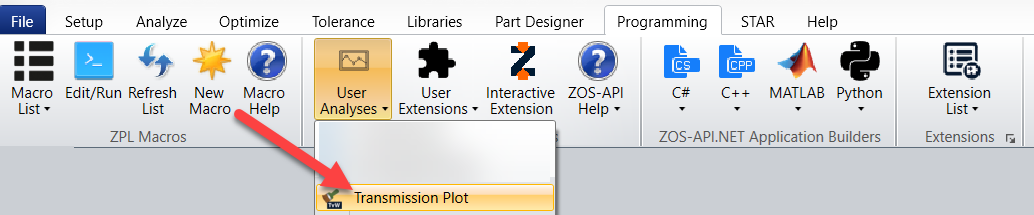
This Zemax User Analysis plots the transmission vs wavelength of different configurations and field points of an optical system. The transmission is calculated by sampling a grid of pupil points and then averaging their transmission. The settings may be saved in a configuration file by using the 'Save' button. This analysis comes with the software. The source code can be found under Download.
Author: Alastair Humphrey
Click here to download | |||
|---|---|---|---|
| Date | Version | OpticStudio Version | Comment |
| 2020/01/01 | 1.0 | - | Creation |