Solved

Mapping defocused and PSF deviation across the FOV

  • 17 March 2023
  • 4 replies
  • 183 views

Hi,

I need to create two maps (grids) presenting deviation of:

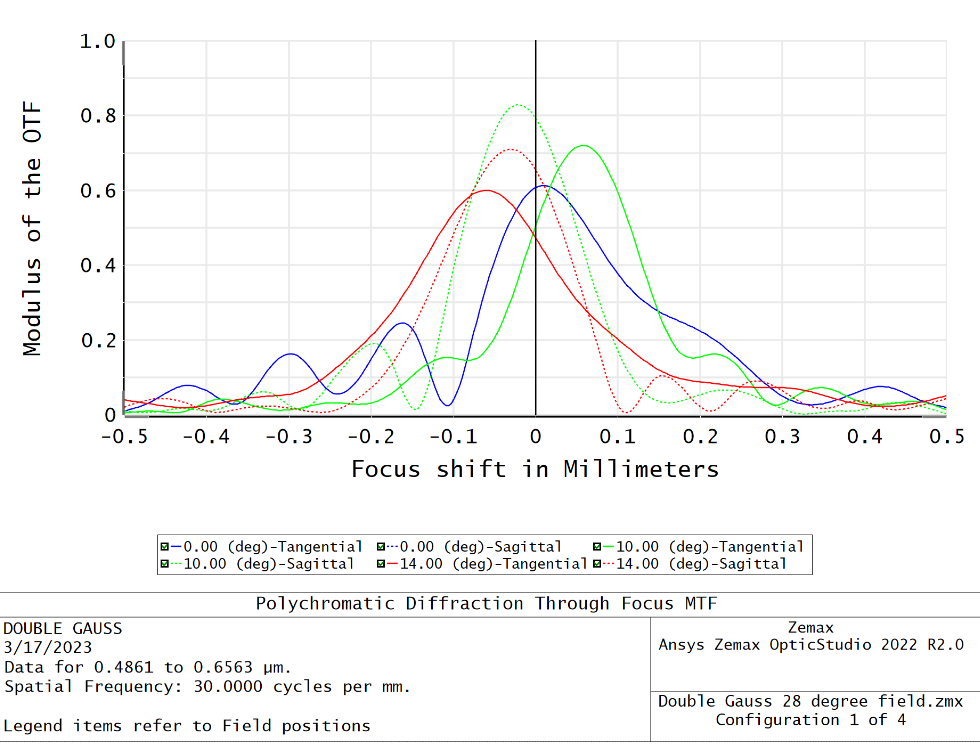
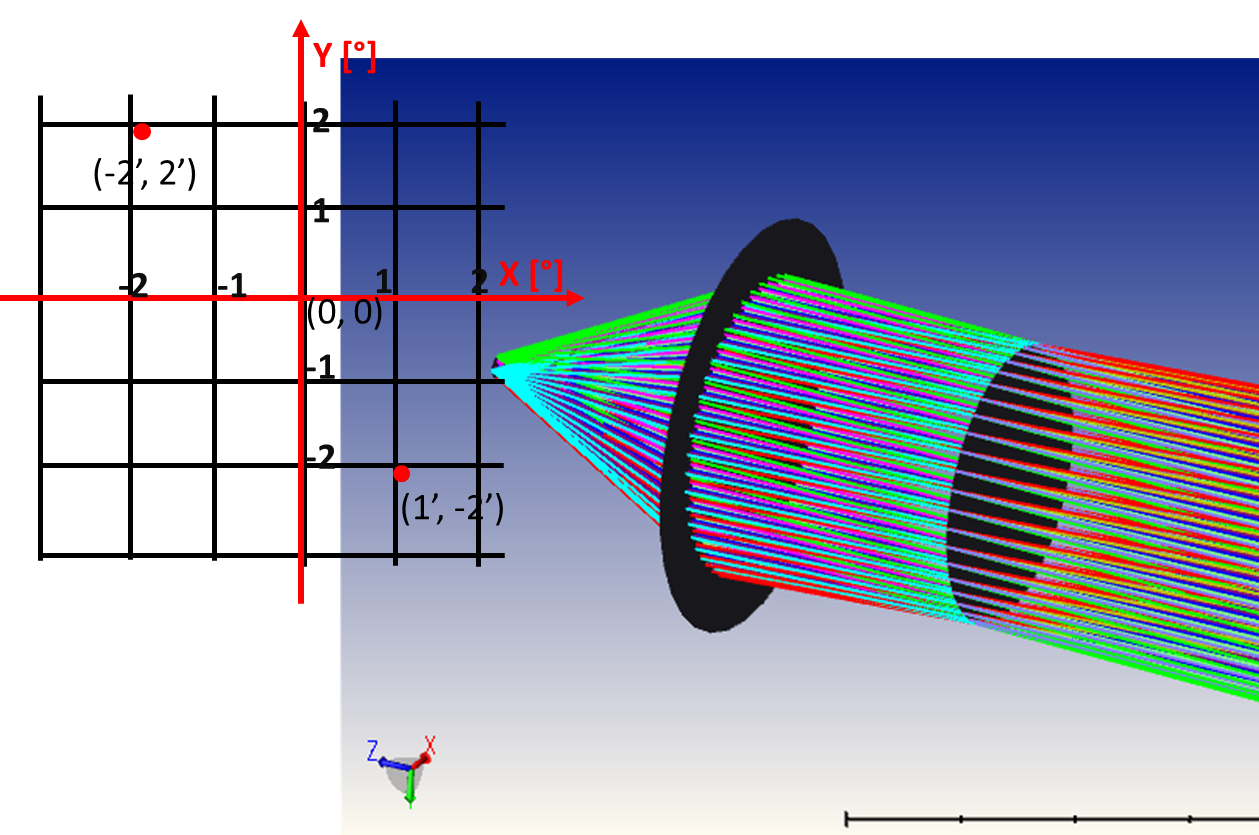
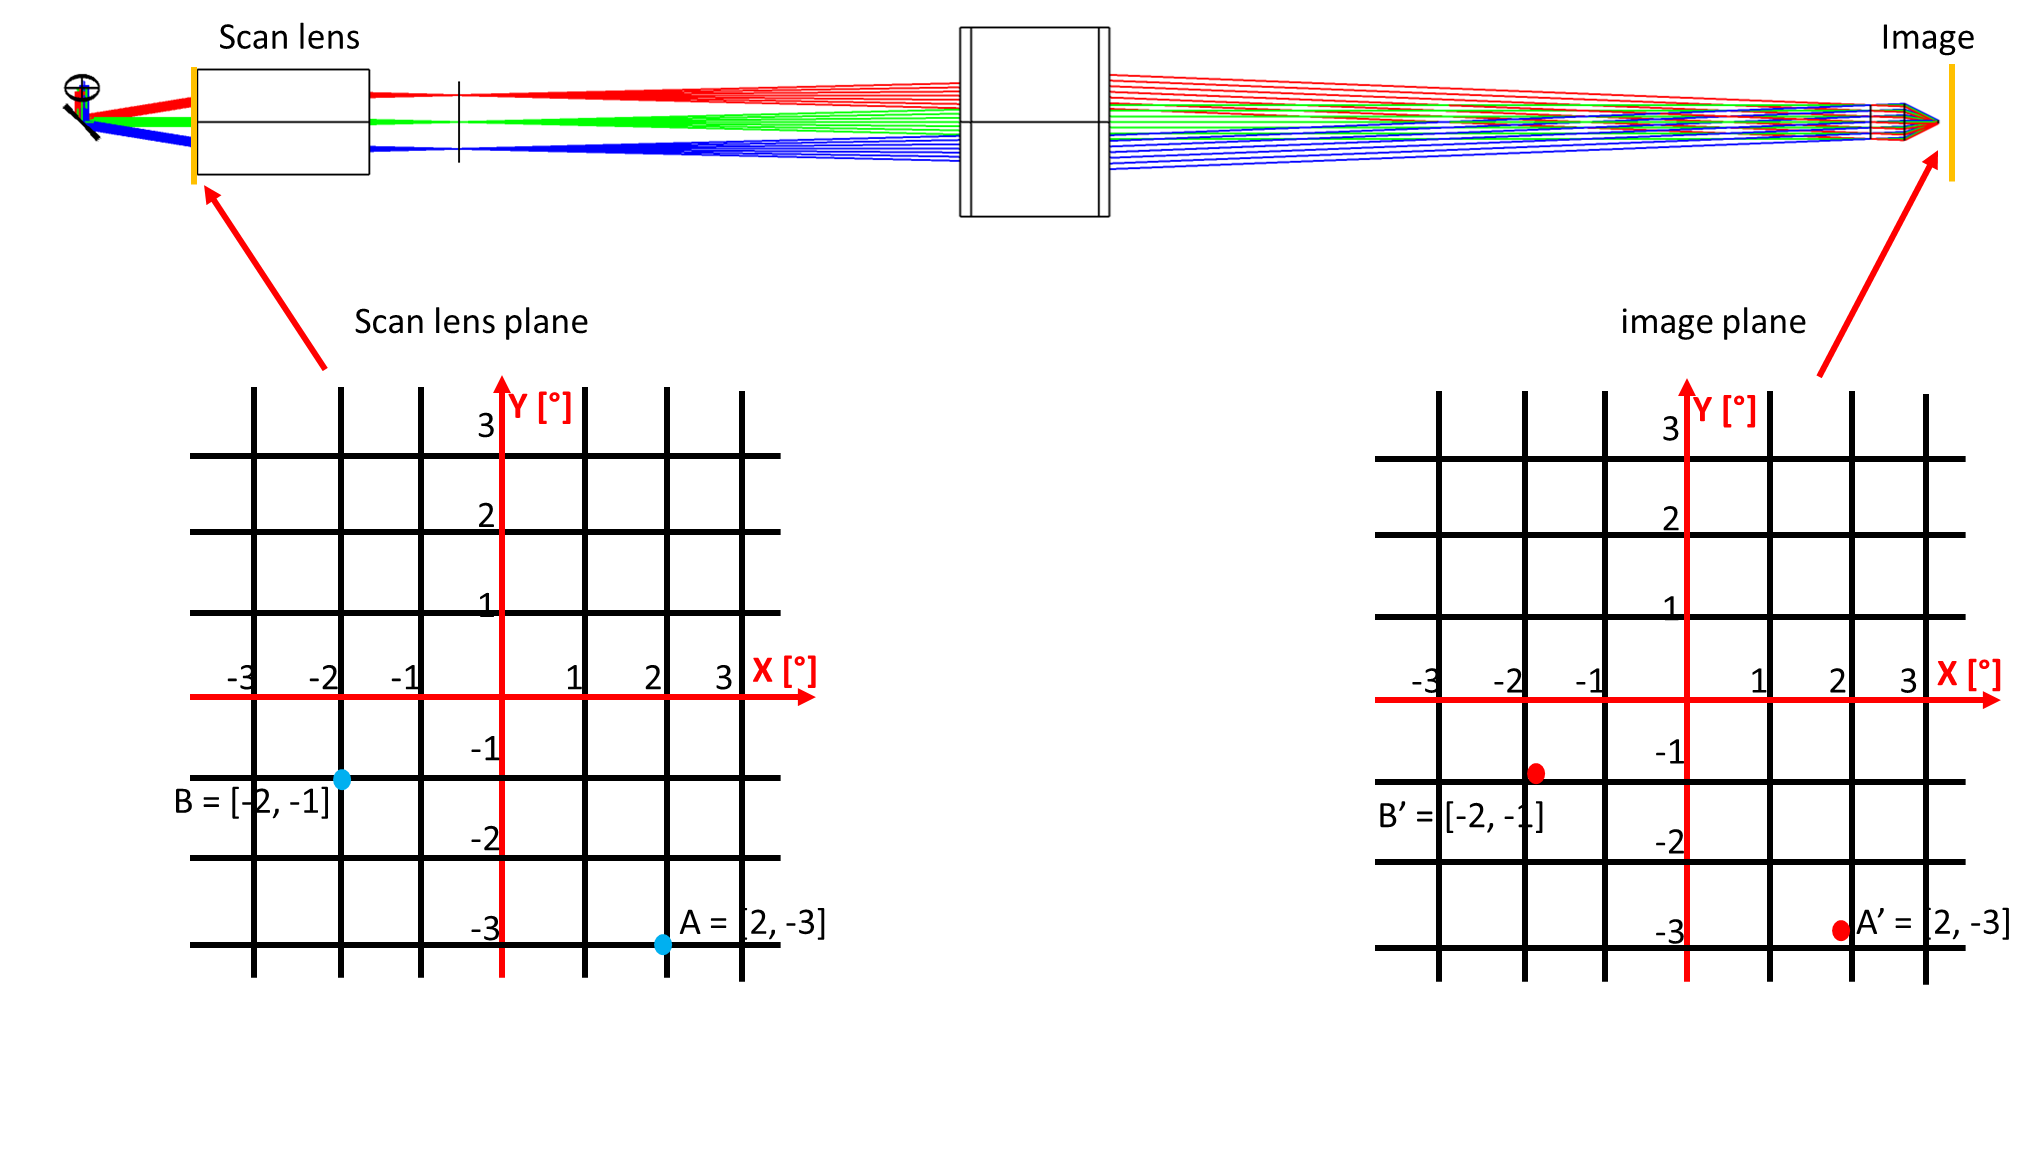
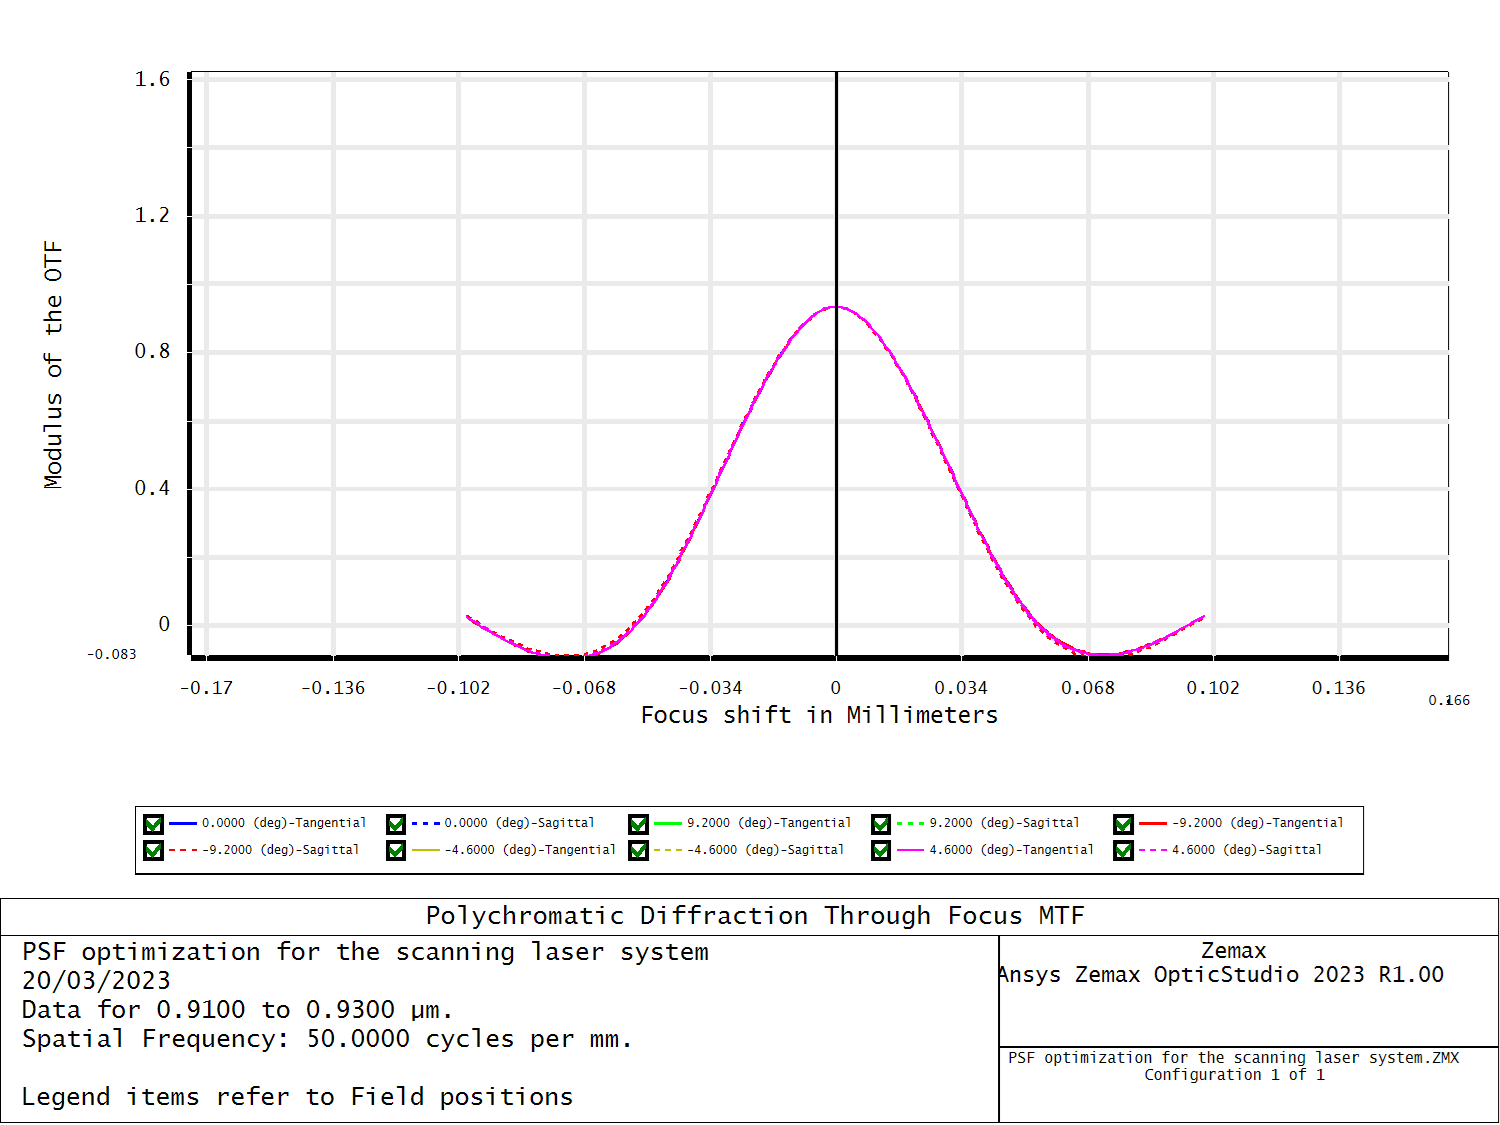
  • best, on-axis focus vs its position on the filed ( on-axis focus vs the amount of off-axis defocus)
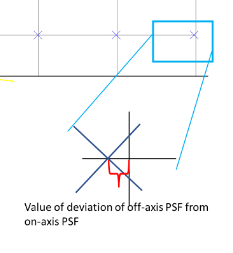
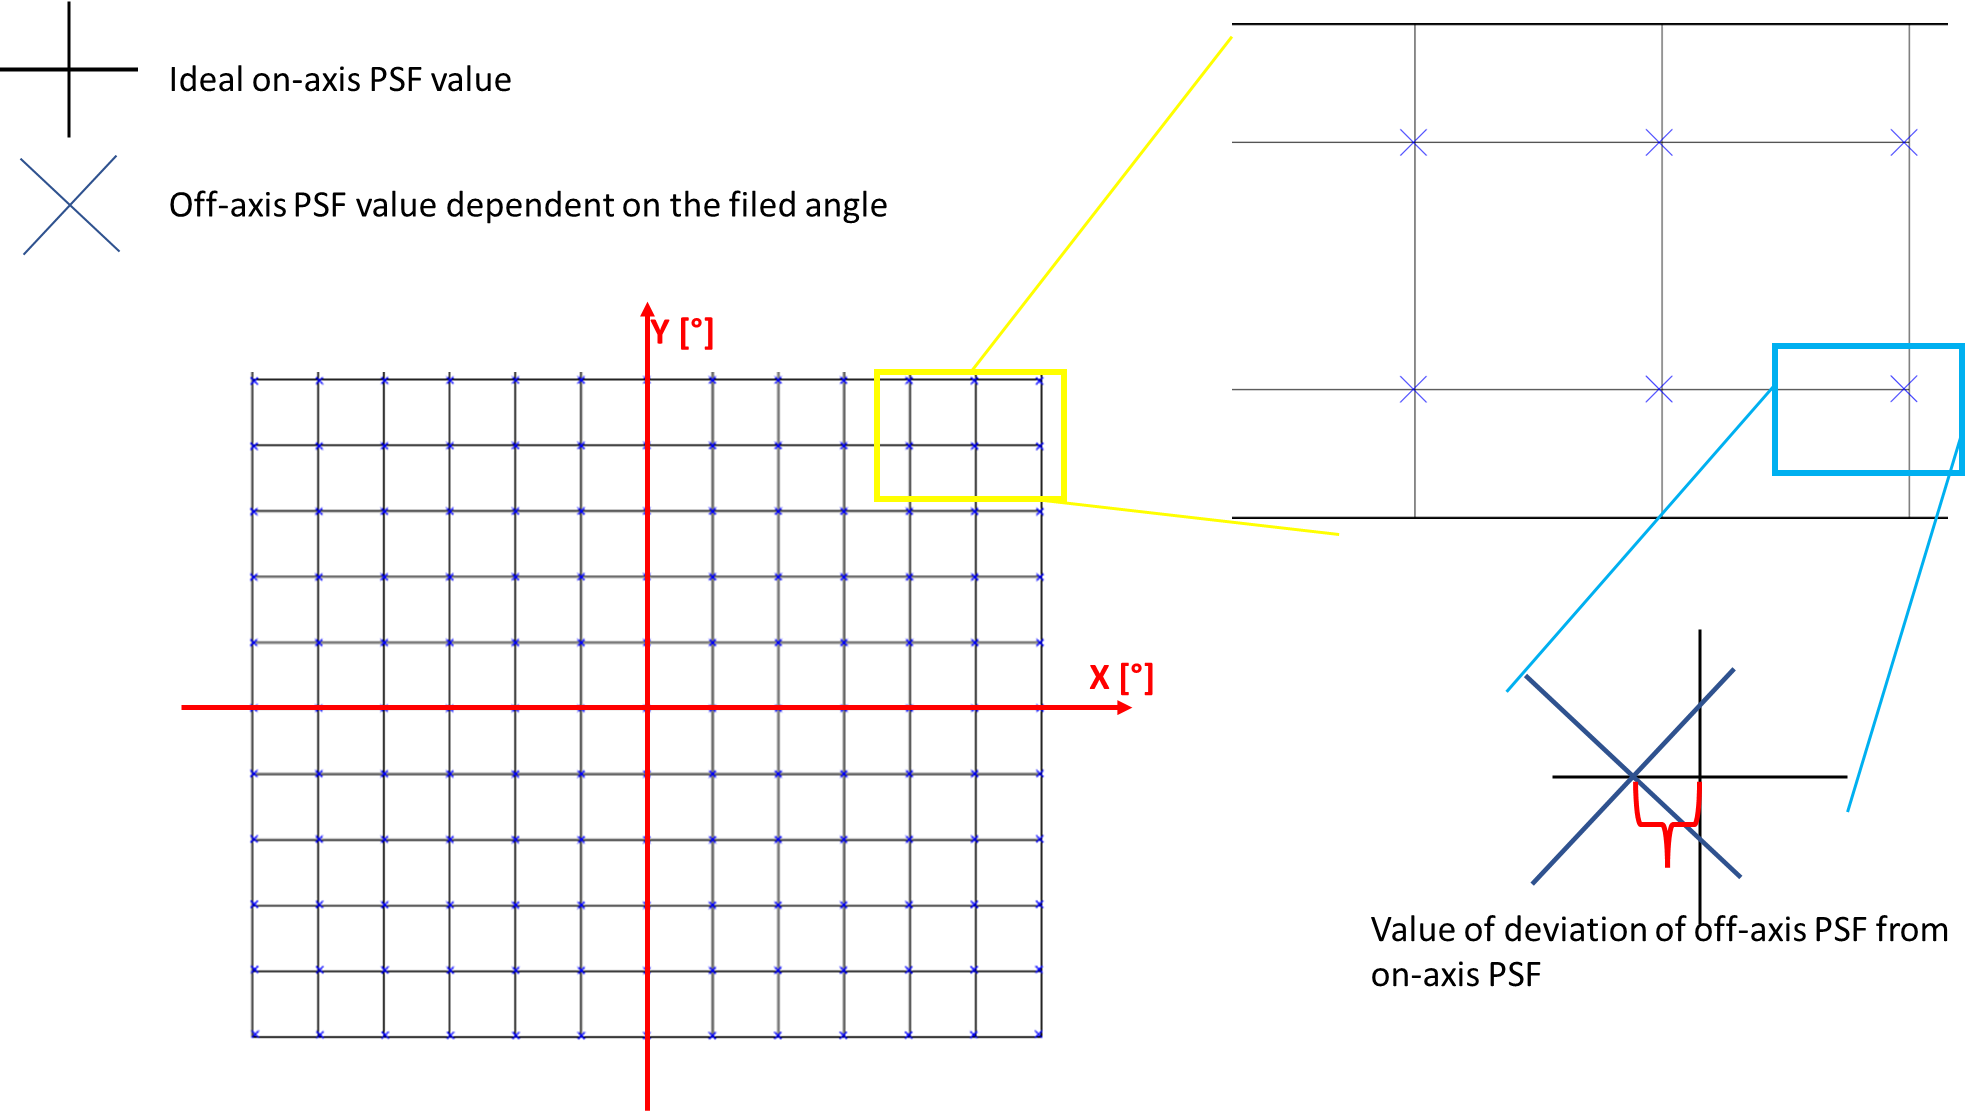
  • on-axis PSF vs off-axis PSF 

The closest things I found in Zemax is Grid Distortion. How to get started with this mapping? Where from to extract this information.  I don’t mind long and laborious work :) I will be grateful for any tips.

With regards,

Marzanna Szwaj

icon

Best answer by MichaelH 17 March 2023, 19:25

View original

4 replies

Userlevel 6
Badge +2

Hi Marzanna,

  • For the best focus, this is a little subjective because you typically need to know what you’re looking for in your field.  I would suggest determining the MTF frequency of your most important feature and then use FFT Through Focus MTF (Analyze > MTF).  This analysis will shift the focal plane & plot the MTF value for the defined frequency.  You can then see for your different fields where the best focal position is 
  • Grid Distortion will only trace the uniform Chief Ray values centered on the select Field.  The red bracket you show in your image is not comparing on-axis to off-axis positions but rather it’s showing the paraxial Chief Ray (paraxial ray trace) location to the real Chief Ray (real ray trace) location for a given field position:
  • If you need PSF centroid locations, I would suggest setting up your Field Data Editor with all the field points you want (you can use the Field Wizard to create a Uniform XY grid) and then use the Merit Function with CEHX/CEHY operands.  This will calculate the centroid location in X/Y for the Huygens PSF (you cannot use the FFT PSF because FFT is calculated in pupil space while Huygens is calculated at the image plane).  This will give you X/Y values w.r.t. to the local vertex of the image plane.  You can then use PARX/PARY to get the paraxial Chief Ray location (which would be the red bracket you have shown above) or simply compare each off-axis CEHX/CEHY to the on-axis CEHX/CEHY.

Hi Michael,

Thank you for your advice. I have a feeling that I wasn’t clear in my question - my apology. 

So this is my system, 2 galvo mirrors, scan, tube, and paraxial lens.

  1. 2 galvo mirrors generate an image plane ( with numbers of coordinates) on scan lens surface using different scan angles
  1. due to optical components the path of the rays  some of those coordinates will be shifted on the field plane

I am expected that this shift will increase with the distance from the centre of the image. I need to set a few coordinates points in the form of the map for different scanning angles, and measure the shift between them for example the deviation between points (-2, 2) and (-2’, 2). 

Regarding PSF, I cannot check it yet, my Zemax is crushing when I am using this tool.

Regards,

Marzanna

Hi,

Although I have already created a topic on this, but I feel I did not explain properly the information I need to extract from the Zemax ( I do apology for it). 

I need to determine change of the spot positions on the image plane vs scan lens plane. I need to do it in a form of the map ( like on the drawings below). The scan lens plane is a reference point ( as this is a first lens surface after galvo mirrors). If there is a shift between points A-A’, and B-B’ I need to be able to measure it.

In my previous post, I messed up the spot position on the field with the focus on on-axis and off-axis rays. Beside, even if the tips given me kindly by Michael H that I should have used FFT Through Focus MFT also applied for spot shift I would still don’t see how this plot could tell me about shift of the spot position. On my graph, all the lines overlapped.

Thank you for your time, and patience :)

Regards,

Marzanna

Userlevel 6
Badge +2

Hi @Marzanna ! Just an admin note to let you know that I have removed the “Best answer” tick and move your latest post here.

As Michael H mentioned, I think you should be able to do that using the centroid positions of the spot CENX/CENY (this is just geometrical optics) and a script (like ZPL or ZOS-API) to create those maps.

Reply