Hi,
In the ZOSAPI, the settings for the Physical Optics Propagation analysis feature are now fully implemented:
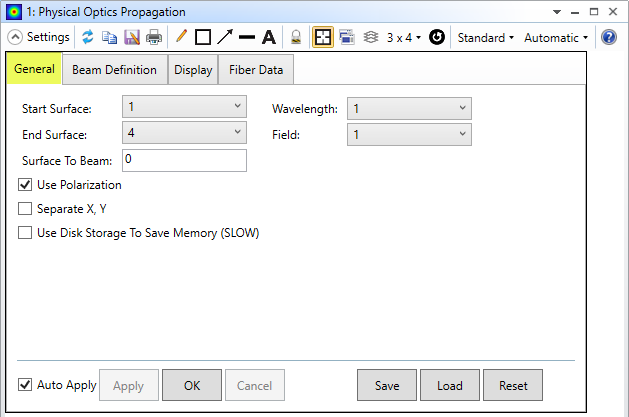
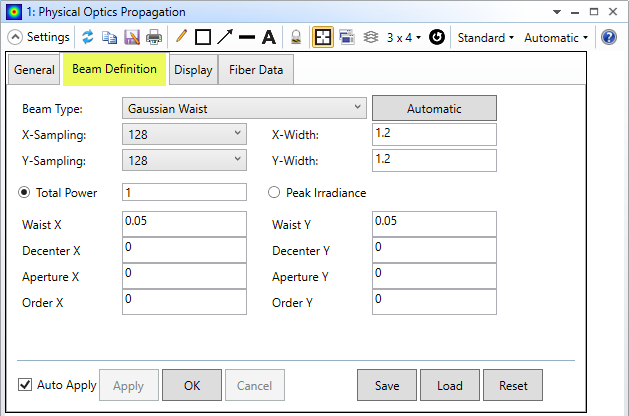
So as an example, we may set the settings in the 'General' and 'Beam Definition' tabs using the ZOSAPI in MATLAB:
TheSystem = TheApplication.PrimarySystem;
TheAnalyses = TheSystem.Analyses;
newPOP = TheAnalyses.New_Analysis(ZOSAPI.Analysis.AnalysisIDM.PhysicalOpticsPropagation);
newPOP.HasAnalysisSpecificSettings;
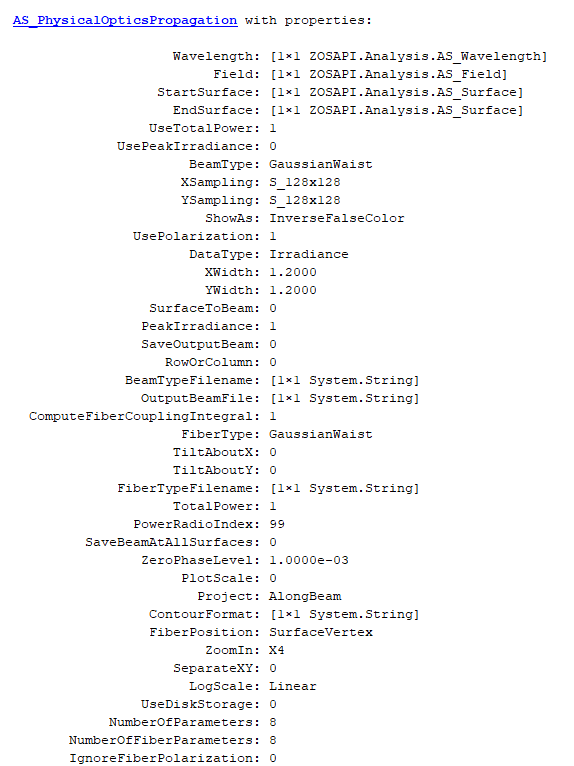
newPOP_Settings = newPOP.Settings();
newPOP_Settings.Wavelength.SetWavelengthNumber(1);
newPOP_Settings.Field.SetFieldNumber(1);
newPOP_Settings.StartSurface.SetSurfaceNumber(1);
newPOP_Settings.EndSurface.SetSurfaceNumber(4);
newPOP_Settings.SurfaceToBeam = 0.0;
newPOP_Settings.UsePolarization = true;
newPOP_Settings.SeparateXY = false;
newPOP_Settings.UseDiskStorage = false;
newPOP_Settings.BeamType = ZOSAPI.Analysis.PhysicalOptics.POPBeamTypes.GaussianWaist;
newPOP_Settings.XSampling = ZOSAPI.Analysis.SampleSizes.S_128x128;
newPOP_Settings.YSampling = ZOSAPI.Analysis.SampleSizes.S_128x128;
newPOP_Settings.XWidth = 1.2;
newPOP_Settings.YWidth = 1.2;
newPOP_Settings.UseTotalPower = true;
newPOP_Settings.TotalPower = 1.0;
newPOP_Settings.SetParameterValue(0,0.05)
newPOP_Settings.SetParameterValue(1,0.05)
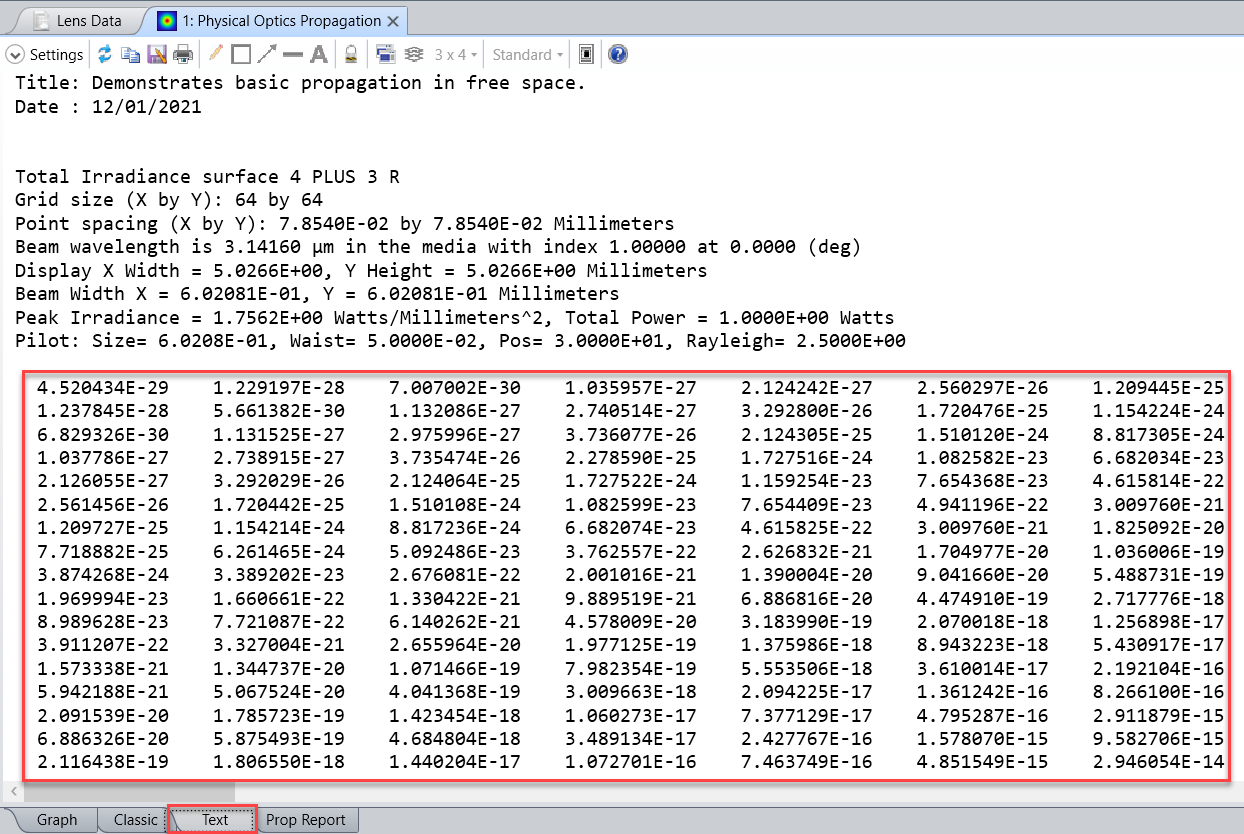
newPOP.ApplyAndWaitForCompletion();
newPOP_Results = newPOP.GetResults();
Best,
Ali