How can I get more than 2 decimals to show on the Z axis? How can I show more incremental values on the X and Y axes? I've tried right clicking and going into Edit Axis Options, but that's not it. I've looked at everything in Project Preferences, nothing there seems to do it. The image in the help documentation shows 4 decimals on the Z axis, so it must be possible.

Edit Axis in Universal 2D Plot

Userlevel 3


Userlevel 7
 +3
+3
We really need a like button for forum posts
Please add at least 1000 votes from me on this; productivity enhancements that reduce the need to export and subsequently process data outside of the OS environment before presenting to others would be a huge win, and would lessen the probability of ever needing to undergo carpal tunnel surgery a second time.
Scott Milligan
Scott Milligan

Userlevel 4
+3
Hi @Sean Turner, it looks like the only way to control the number of digits displayed in the axial increments is by artificially setting the Min/Max values for the axis. For example, if I set my plot to go from 0.4862 to 0.6563, I end up with 4 decimal places for each separator. However, if I go from 0.45 to 0.65, I end up with two decimal values. Going from 0.455 to 0.655 also yields two decimal places, as it seems OpticStudio wants to show 10 incremental values.
In any case, I'll make sure to share this thread with our product and R&D teams in recognition that taking your data to another program to plot it is clearly not the ideal situation!
In any case, I'll make sure to share this thread with our product and R&D teams in recognition that taking your data to another program to plot it is clearly not the ideal situation!
Userlevel 3
I have another problem with the universal plots. When overlaying multiple series, the legend entry for the initial series cannot be edited. This initial series does not even show up under "available series" in the overlay series window. One more reason to export data and graph outside Zemax.
Userlevel 1
The best way to graph in Zemax is currently to graph outside of Zemax.
It would be nice if it was possible to use Zemax to plot data in a decent way.
It would be nice if it was possible to use Zemax to plot data in a decent way.
Userlevel 2

Improving the quality of the all the graphics and graphing in particular is definitely something that I would like to see. When you think of how central the presentation of graphical information is to understanding lens performance and how poor this is in Zemax (decidedly 1990's) I think that it should be one of the top priorities for 2020. I too end up spending too much time exporting raw data from Zemax because if I use the native Zemax graphics it looks like I am using 20 year old software!
Andrew
Andrew
Userlevel 6
 +4
+4
Please add my vote to this. And I would also like to see a refinement of the line graphs available in OpticStudio.
I would like to see:
- The ability to change the axes labels of a Universal Plot to labels more meaningful than, for example, the merit function operand.
- All graphs offering the ability to export data in TSV format.
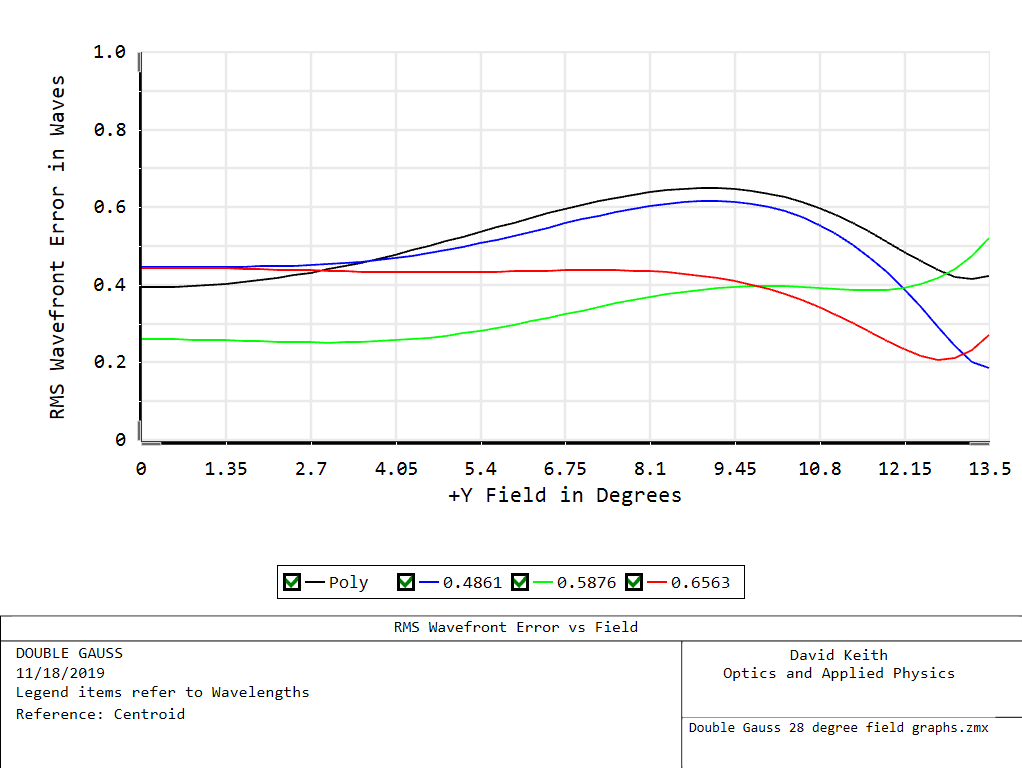
- An improvement in the tick/gridlines assigned automatically so that they are "nice" divisions. An example is given below.
Here is what OpticStudio produces automatically. The divisions are not nice and make it difficult to read data from the graph:
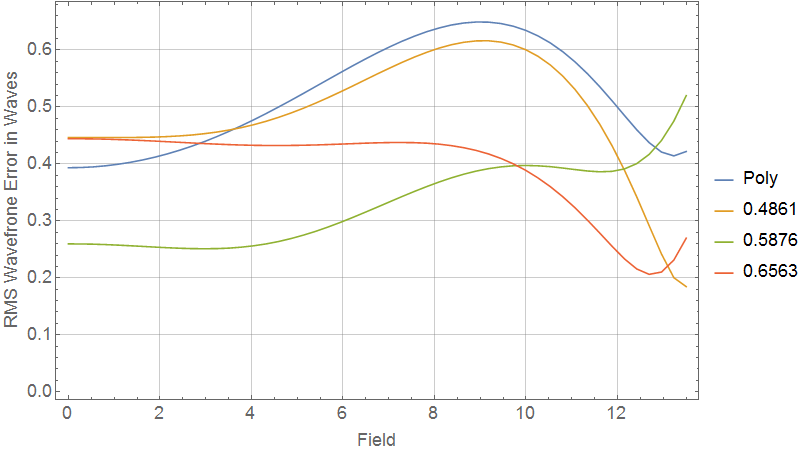
When I need to present a graph to management or to a client, I go through the extra work of importing the data into Mathematica. Here is what Mathematica produces:
Kind regards,
David
Reply
Enter your username or e-mail address. We'll send you an e-mail with instructions to reset your password.
Need more help?
To Chinese users:
Do not provide any information or data that is restricted by applicable law, including by the People’s Republic of China’s Cybersecurity and Data Security Laws ( e.g., Important Data, National Core Data, etc.).
不要提供任何受适用法律,包括中华人民共和国的网络安全和数据安全法限制的信息或数据(如重要数据、国家核心数据等)。