ZPL Operand: Extract FWHM from non-sequential detector


Userlevel 6
Badge +2

Description:


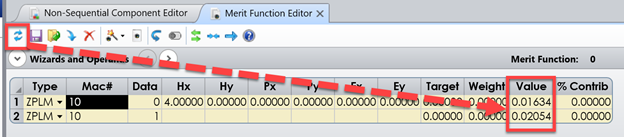
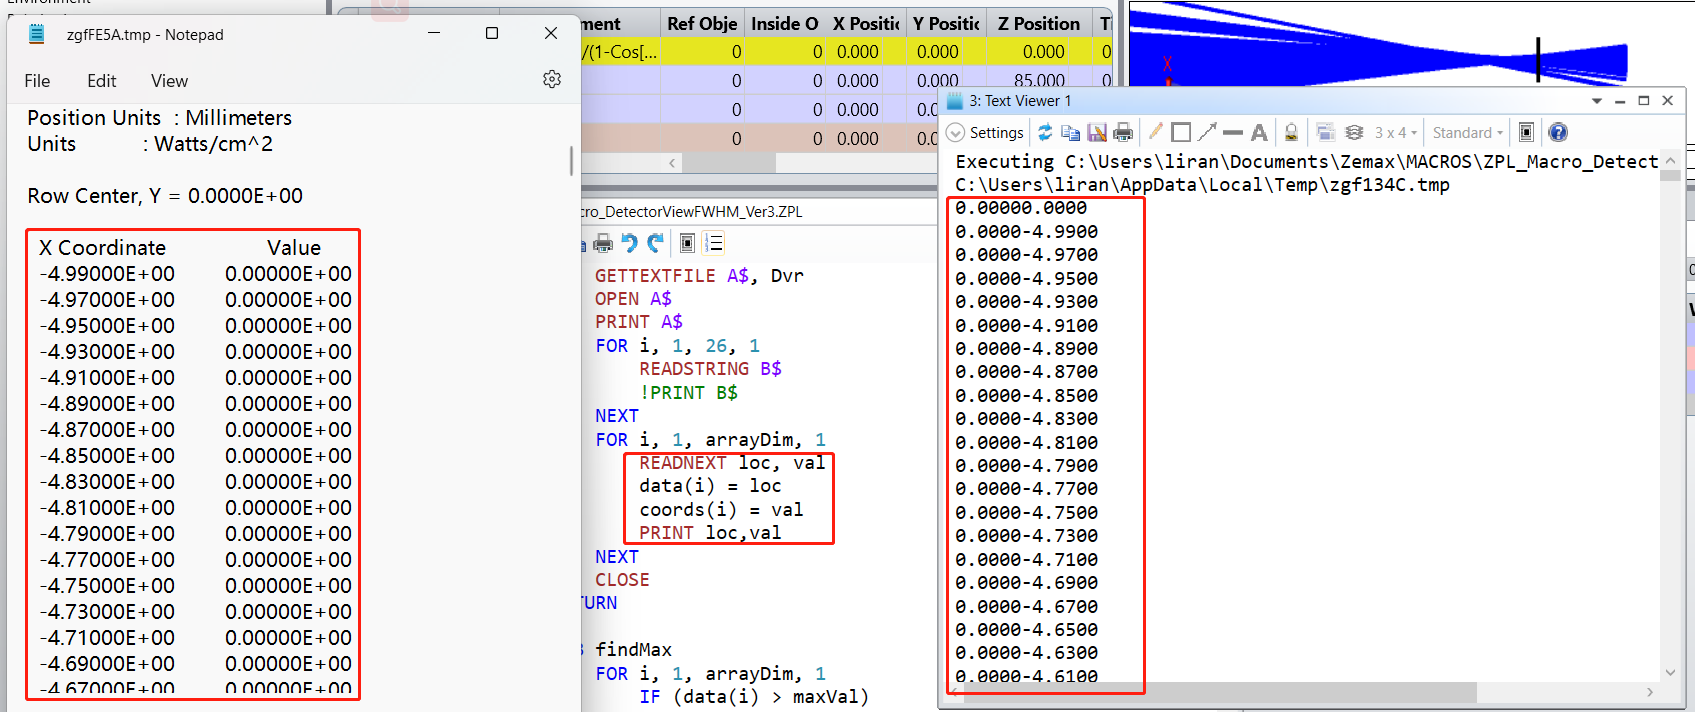
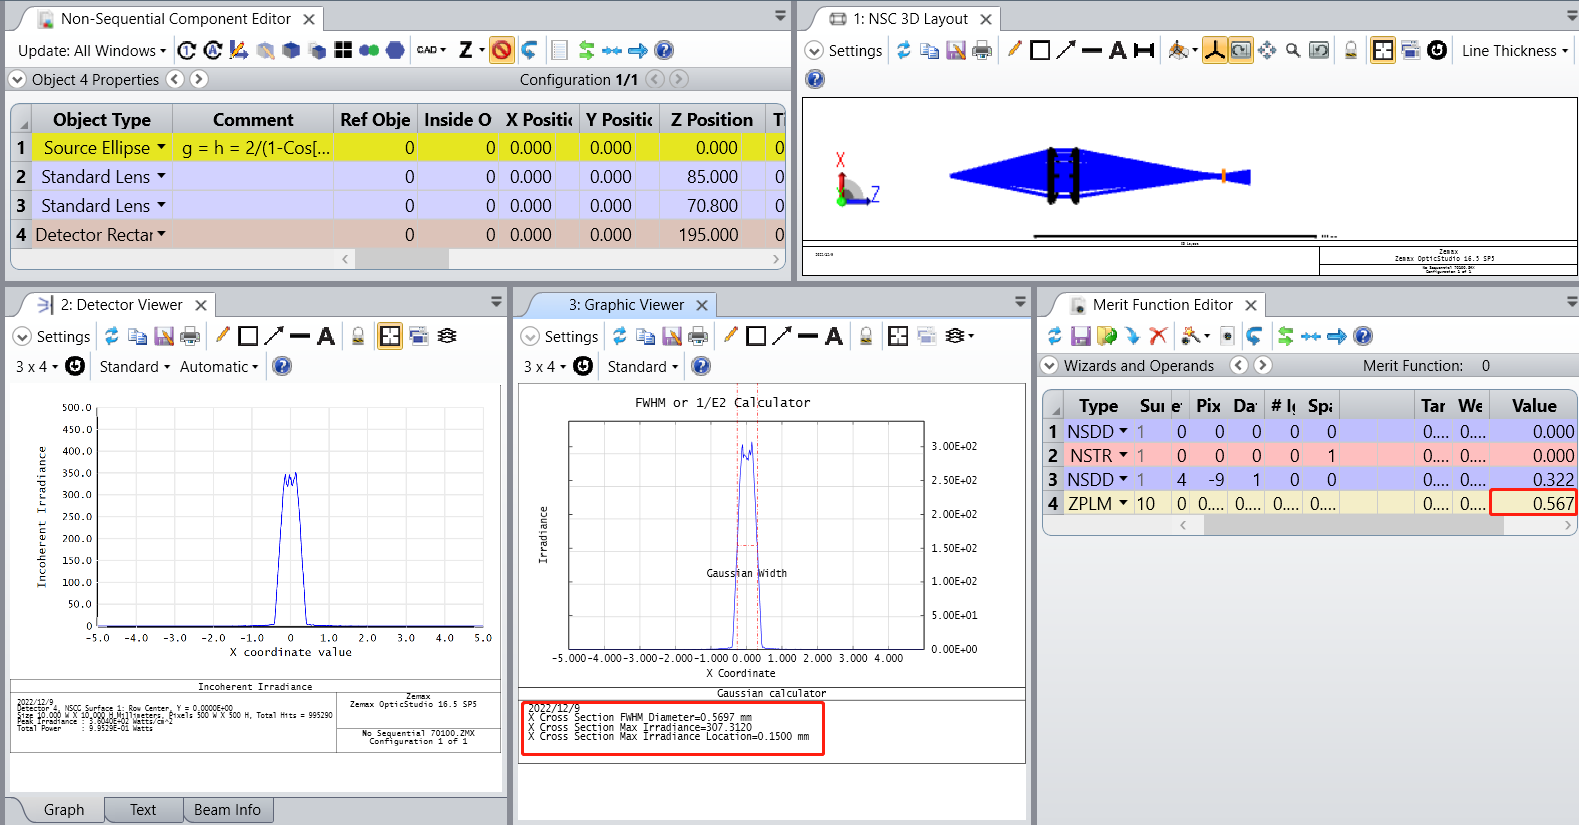
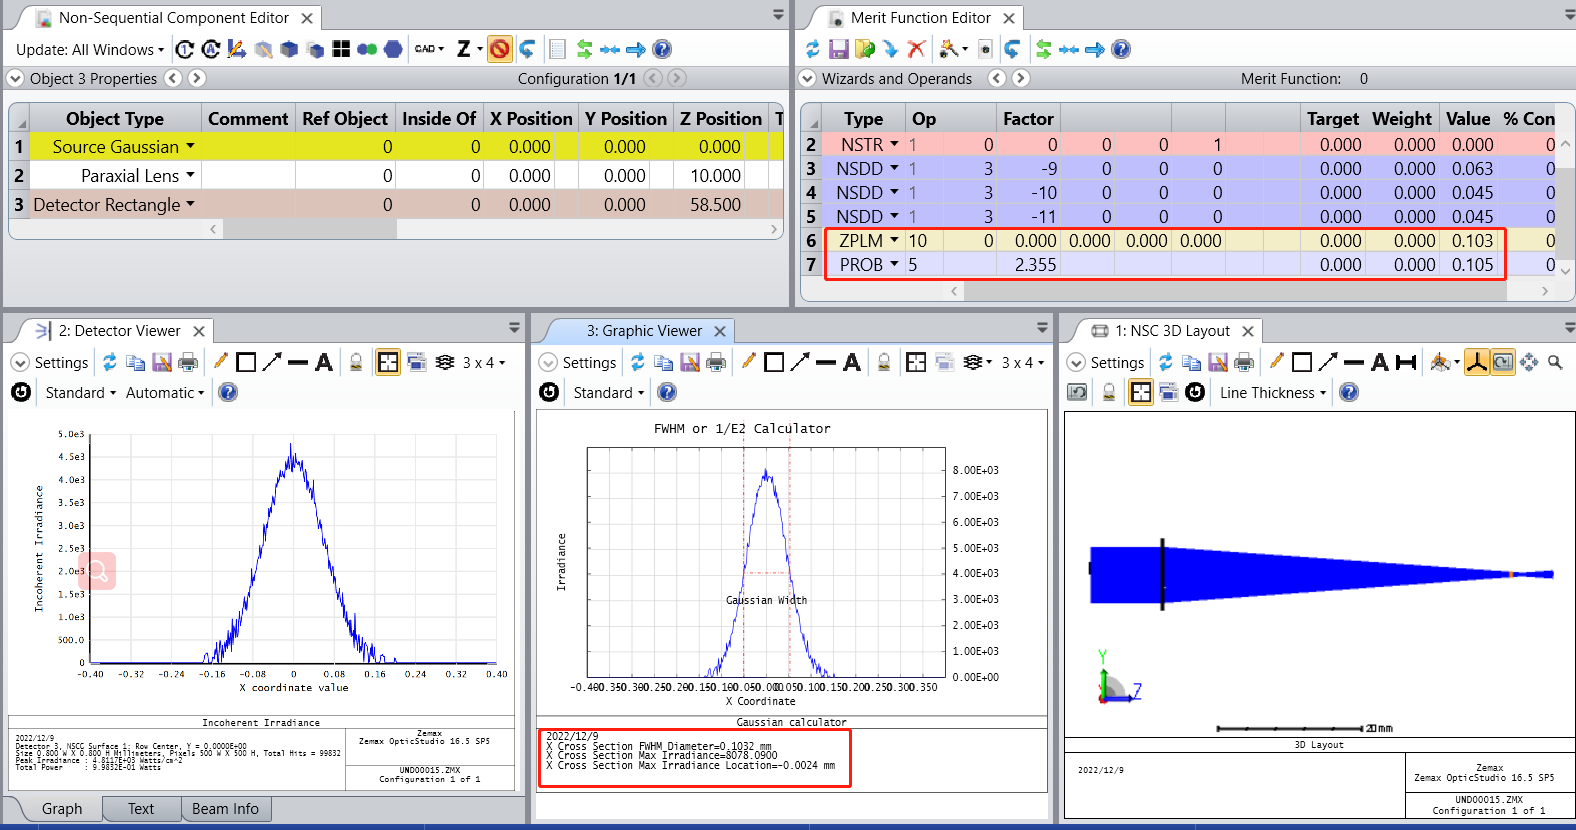
This macro will calculate the approximate FWHM of a near-Normal distribution of data. This macro assumes symmetry about the maximum value and assumes a minimal amount of noise between 0 and the maximum. The macro will update the Detector Viewer settings to a cross-section view. Then, the data will be extracted and evaluated. When using the ZPL10 version of the macro, the approximate FWHM will be reported when Data = 0 for the X-direction, and Data = 1 for the Y-Direction. Use the Hx entry to specify the detector of interest.


Language:

ZPL

Updates:

10/22/2021 - Stability and calculation updates. The calculation is now more robust. The code for finding the CFG file has been updated. See the ReadMe for more information. 

Download:

Click here to download

Date Version OpticStudio Version Comment
2019/10/15 1.0 19.4SP2 Creation
2020/10/14 2.0 20.3

Updated macro with the following

- CFG file is programmatically calculated

- FWHM index location calculation updated to match Excel LOOKUP function

- FWHM index location calculation repaired to check for +/- index value location
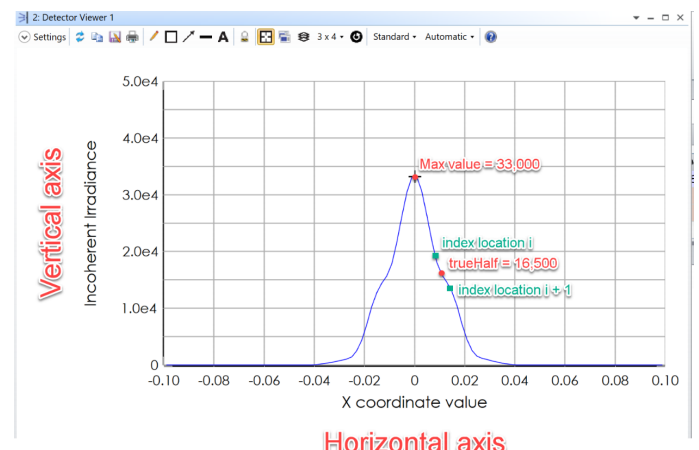
2021/10/22 3.0 21.3

Updated macro with the following:

- CFG filename search has been updated. The previous method searched for any CFG file. The new method will search for the file-specific CFG file. This is useful if the lens file is stored in the same directory as others.

- The calculation has been updated. Previously, the calculation assumed perfect symmetry of the array of data. This caused the calculation to fail if the distribution was not centered on the detector. Now, the HWHM is calculated for one side and doubled.

- The FWHM calculation is now more robust, finding the exact location of the half max instead of using the closest available location in the array of intensity data.


12 replies

Userlevel 3
Badge

Hi, Allie.

Just saw this, and am grateful for your industriousness and posting it here for everybody; but I’m not sure yet how useful it will be for me.

Basic questions are, “How ‘relatively Gaussian’ or ‘near-Normal’ does the detector data have to be?” and its relative, “How ‘smooth’ a curve does it have to be for this to work?” (and what does “work” mean?)

This is a function I have wanted for years, and some somewhat hidden features in Sequential implement something similar.  In my case, I often want to get the FWHM of some data like a Geometric Image Analysis “detector” image of a CIRCLE.IMA input (e.g. from a multimode fiber).  But noise in the data (especially peaks) messes with a simple-minded calculation defining the “Maximum” at the peak irradiance.  Some sort of smoothing of the data...e.g., to fit the flat top in what I described...is needed.  Then a bit of smoothing that doesn’t broaden the shoulders too much, either, and erroneously increase the FWHM!  How to pick the “amount” of smoothing?  Can the built-in smoothing features in the Graphics Window be used?

In the case of a Gaussian (or an apparently Gaussian beam with M^2 > 1), I think there should be a built-in function in OpticStudio to calculate beam widths based on the second moments.  Second moment beam widths are supposed to work for beams with arbitrary M^2, although they tend to amplify noise in the “tails” (as opposed to the peaks).  I think that some merit function operands or analysis windows already provide this in the form of what I referred to above as a “somewhat hidden feature.”

-- Greg

Userlevel 6
Badge +2

Hi Greg,

Thanks for your questions here and sorry for the delay in my response. 

You’ve brought up some good points and have helped me identify items for future improvement. When I mention the requirement of this being “near-Normal” I mean that the detector results must have a single maximum point. At this time, the macro will assume symmetry about the maximum value. If there are multiple maximums then the FWHM calculation may not be valid. 

Additionally, I have found that the smoothing function in the Detector Viewer will work with this macro as long as you SAVE the detector settings before running it. I have no recommendations for the amount of smoothing to use as this is applied on a relatively case-by-case basis. Ultimately I would say you should use the smallest amount of smoothing necessary to obtain a single peak. 

In my testing of this for your questions, I found a particularly annoying limitation that I did not previously consider: the results must be centered on the 0 X or Y coordinate or the calculation or the FWHM calculation (which uses halfMaxX and halfMaxY as an index value) will throw an error. That’s what I get for testing with well-behaved sample files. Obviously there’s a bit of work I’ll need to do to make this more robust 😅 so I thank you for bringing it back to my attention 😊.

Regarding your last point - the, NSDD will report the second moment in any direction with the following data values so that may be useful for future calculations:


Let me know if anything else comes up and have a great weekend!


Userlevel 6
Badge +2

Hi Greg,

After finding that limitation on Friday, I decided to re-write some of the code this weekend. I have a new version prepared and I have sent it to a colleague for testing. In the new version, the assumption that the data is symmetrical about the max value is still present, but the calculation of the location of the half max is more robust. I’ll post the new code once it’s undergone some review but let me know if you have any interest in trying it out before that time. Thanks again for your comment about this. Let me know if you have any other questions about this. 


Edit: Version 3 is now available at the link above. 

@Allie 

Hi, Allie,

Thanks, your article is very helpful to me, but when I test in zemax it reports an error and cannot run, what can I do to solve it? 


Hello, Does anyone see my question?

Userlevel 6
Badge +2

Hi Lenror,

First, just want to state that I haven’t run this ZPL before so I’m only looking at the syntax.

It appears that you are trying to run this ZPL from the Programming Tab and not from the Merit Function Editor via a ZPLM.  Try to comment line 12 and uncomment line 11.  This will then call a popup input dialog asking the user for the detector number and then the DECLARE should work.

If you look at the two DECLARE statements in the ZPL, you can see that the 4th argument (arrayDim) is supposed to be the length of first dimension of the array.  The arrayDim is a variable that comes from the NPAR() function.  This function by default returns 0, even if an invalid detector is requested.  So, if you have a detector which is not actually present, the NPAR() will make arrayDim 0, and then the DECLARE will throw an error.

If you look at line 12, the detector variable is expecting to be defined by via a ZPLM operand with the Pass Variable Hx (PVHX) column.  If the ZPL is not called via a ZPLM, then the PVxx() values become 0, most likely causing the error.  

** a useful update to v4 could be to default the detector variable to the first listed Detector Rectangle in the NCE  if the detector variable is 0 (just like a Detector Viewer does).

@MichaelH 

Hi Michael, 

Thanks for your advice, I set the detector number and it worked, but a new error is below.

I found the “trueHalf=0.4970” is strange, it is half of the coordinate but not half of the intensity. And when I “change data(i)=loc coords(i)=val”, it works well.

My zemax version is 16. The reason is because my version is too old? 


Userlevel 6
Badge +2

Perfect, this site just crashed and deleted my answer (Zemax, check with your Zendesk vendor and have them save the answers typed into this box as a variable in javascript localStorage...I shouldn’t have to retype an answer because of some error on your hosting platform).

Without retyping everything, I think your version is off-by-one in the lines they are trying to parse.  The first iteration of the loop is probably trying to parse the “X Coordinate Value” line and the actual data isn’t parsed until row 2col 2 of the FOR loop.  Try adding a READ keyword directly before the FOR i, 1, arrayDim, 1 line.

If you need to modify the ZPL further, I would suggest using READSTRING and $GETSTRING().  This ensures that you are reading the expected column of data rather than having off-by-one like this might be.

Userlevel 7
Badge +3

Hi Allie,

Since NSDD gives the second moment, can’t you just get the FWHM as 


See https://en.wikipedia.org/wiki/Full_width_at_half_maximum

 @MichaelH 

Hi Michael,

     I'm not proficient in the code part, I will take time to study your suggestions later. I checked the code and I think it has some shortage.

The code only finds the maximum value, trueHalf=maximum value / 2, calculates the trueHalf coordinate and maximum value coordinate, obtain FWHM=maximum coordinate-trueHalf coordinate)*2. 

So, if the Gaussian beam is not perfect or the max value is not in the center, the result will be inaccurate. 

I modified the code, calculated the trueHalf coordinate of left and right side, and used the plot to show it. I think the calculated result is more suitable for me. At the same time, I'm not proficient in the code part to judge if my code has mistakes or not. So I shared the code file and hoped you could take free time to help me check it. 


Hi Mark,

     I tested your advice. It is very close to the FWHM result calculated by me. Similarly, I think this calculation requires that the Gaussian beam is perfect. 


Reply